CTAs Exposure to Equities
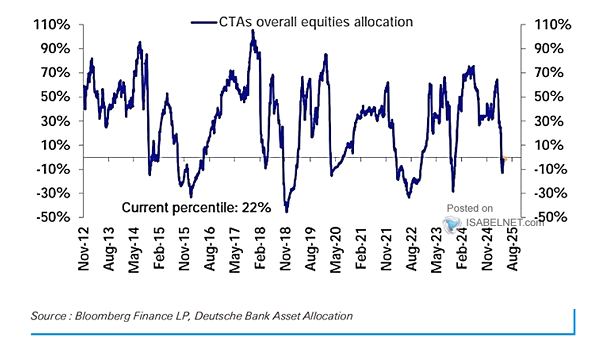
CTAs Exposure to Equities CTAs have increased their long equity positions to a moderate-high level, reaching the 41st percentile. This reflects a notable increase in their equity exposure over the past few months. Image: Deutsche Bank Asset Allocation