S&P 500 Net Profit Margin
S&P 500 Net Profit Margin The anticipated expansion in S&P 500 net profit margins over the upcoming quarters suggests a potentially favorable outlook for profitability. Image: Goldman Sachs Global Investment Research
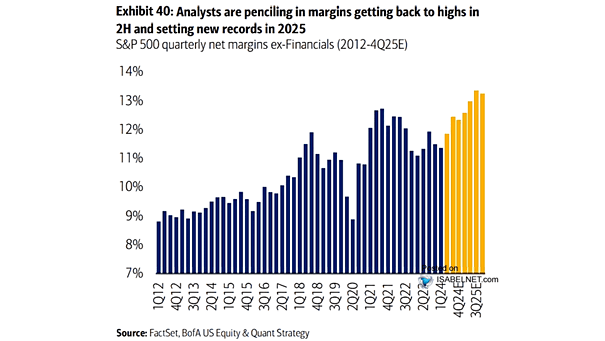
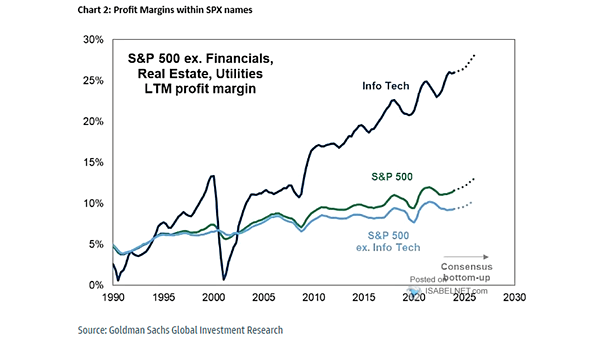
S&P 500 Net Profit Margin and Info Tech and Communication Services Margins The “tech” sector continues to sustain high profit margins in comparison to other industries, highlighting its robustness and resilience in the ever-evolving market landscape. Image: Goldman Sachs Global Investment Research
MSCI All Countries vs. Median Profit Margin All Countries Will global corporate profitability improve in the coming quarters? Image: Topdown Charts
S&P 500 Profit Margin – Operating Earnings/Sales S&P 500 profit margins remain strong at 11.2%, despite many headwinds and higher labor costs. Image: J.P. Morgan Asset Management
U.S. PPI Less U.S. CPI vs. S&P 500 12-Month Forward Profit Margin Are margins at risk, as they tend to be correlated with the spread between PPI and CPI? Image: Morgan Stanley Wealth Management
Univ. of Mich. Consumer Sentiment Index and Russell 1000 Index, Trailing 12-Month Gross Profit Margin Should investors expect gross profit margins to disappoint in the coming months? Image: Morgan Stanley Wealth Management
S&P 500 Operating Profit Margins U.S. profit margins have narrowed as corporate prices have become lower than labor costs. Image: BCA Research
U.S. NIPA Profit Margins and Recessions U.S. corporate profits are booming. Image: Oxford Economics
S&P 500 vs. Peaks in Real Profit Margins When will the S&P 500 fall? Keep an eye on real profit margins. Image: Real Investment Advice
S&P 500 vs. Profit Margins Do valuations still matter? The current divergence between the S&P 500 and profit margins is huge. Image: Crescat Capital LLC