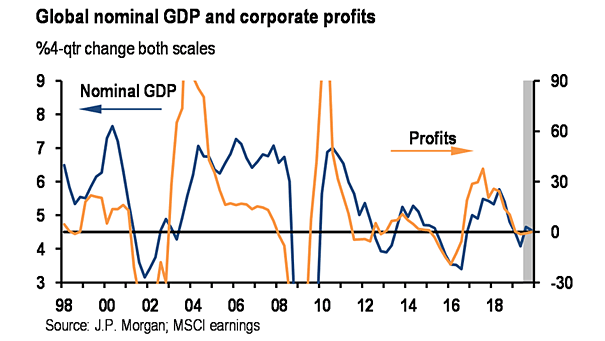
Global Nominal GDP and Corporate Profits
Global Nominal GDP and Corporate Profits This chart shows the correlation and the slowdown in global growth and corporate profits. Historically, margin pressures have preceded the start of recessions. Image: J.P. Morgan