Fed Funds vs. 2-Year U.S. Treasury Yield (Leading Indicator)

Fed Funds vs. 2-Year U.S. Treasury Yield (Leading Indicator) The current 2-year U.S. Treasury yield, which is below the federal funds rate, indicates that the Fed’s monetary policy is restrictive. Furthermore, the 2-year yield typically leads the fed funds rate by about 20 weeks. Image: Morgan Stanley Research

Market-Implied Path of the Fed Funds Rate

Market-Implied Change in Fed Funds Rate Traders are anticipating a significant shift in the Fed’s interest rate policy, predicting a total of 223 bps in cuts over the next 12 months due to weakening economic indicators, such as rising unemployment and easing inflation. Image: Goldman Sachs Global Investment Research

Interest Rates – Fed Funds Futures Curve

Interest Rates – Fed Funds Futures Curve Market participants are projecting that the Federal Reserve’s terminal rate, which marks the end of the rate cut cycle, will be around 3%. Image: The Daily Shot

Federal Funds Rate

Federal Funds Rate By aligning market expectations with its policy intentions, the Fed minimizes surprises in the fed funds rate relative to market pricing at the start of the blackout period, thereby reducing the likelihood of market disruptions. Image: Deutsche Bank

Fed Funds Forecast vs. Market Pricing

Fed Funds Forecast vs. Market Pricing While the Fed has made progress in the fight against inflation, BofA holds a significantly more hawkish view on Fed policy compared to market expectations. Image: BofA Global Research

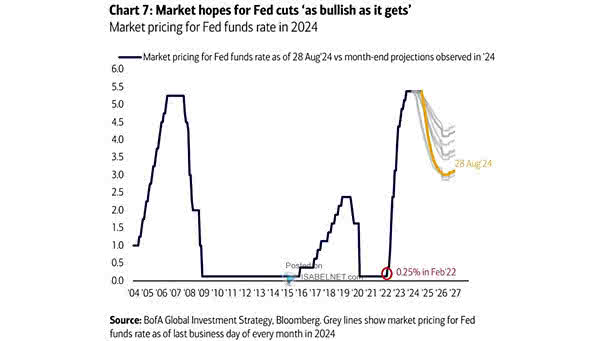
Current Market Pricing for Fed Funds Rate

Current Market Pricing for Fed Funds Rate Traders predict that the Federal Reserve’s terminal rate, which marks the end of the rate cut cycle, will be around 3%. Image: BofA Global Investment Strategy

Federal Funds Target Rate

Federal Funds Target Rate In recent history, the Fed hasn’t begun a rate cut cycle with a 50 bp move unless it occurred during an unscheduled meeting or was preceded by one. A 25 bp cut appears to be the most probable outcome for the Fed’s September meeting. Image: Deutsche Bank

% of Large-Cap Mutual Funds Outperforming their Benchmarks

% of Large-Cap Mutual Funds Outperforming their Benchmarks 66% of large-cap mutual funds have underperformed their benchmarks year-to-date, which is concerning for investors seeking above-average returns from these funds. Image: Goldman Sachs Global Investment Research

Flows into Equity and Bonds Funds

Flows into Equity and Bonds Funds Substantial inflows into equity and bond funds are fueled by investor optimism regarding falling inflation and the potential for interest rate cuts by the Fed. Image: Deutsche Bank Asset Allocation

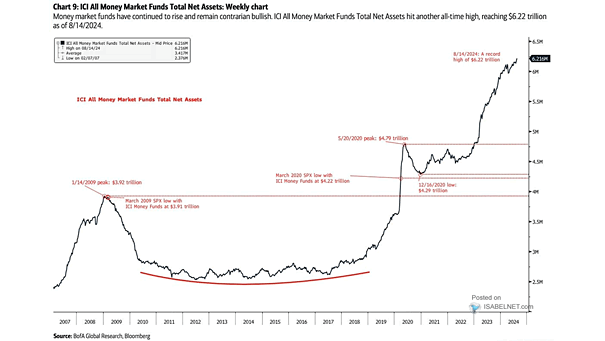
All Money Market Funds Total Net Assets

All Money Market Funds Total Net Assets Investors currently hold $6.22 trillion in money market funds, a figure that is being interpreted as contrarian bullish for the stock market. Image: BofA Global Research