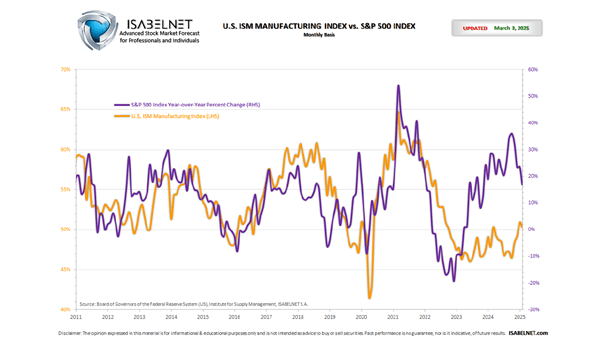
ISM Manufacturing Index vs. S&P 500 Index
ISM Manufacturing Index vs. S&P 500 Index This chart shows the correlation between the ISM manufacturing index and the S&P 500 index year-over-year percent change, since 2011. The U.S. ISM Manufacturing Index in June stands at 48.5%, below the consensus forecast of 49.1%, which is indicative of a contraction in the manufacturing sector. Click the…