U.S. 10-Year Real Yield (TIPS)
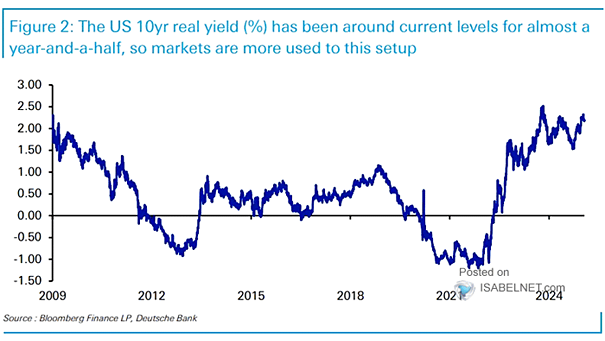
U.S. 10-Year Real Yield (TIPS) The relative stability of the U.S. 10-year real yield has created a market environment where investors have become accustomed to these levels. Image: Deutsche Bank
U.S. 10-Year Real Yield (TIPS) The relative stability of the U.S. 10-year real yield has created a market environment where investors have become accustomed to these levels. Image: Deutsche Bank
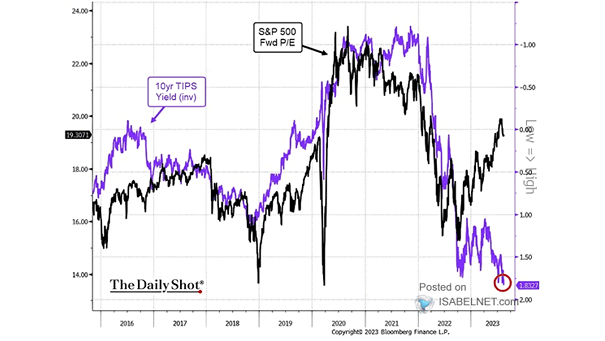
Valuation – S&P 500 Forward P/E and U.S. 10-Year U.S. TIPS Yield The S&P 500 forward P/E multiple tends to be negatively impacted by higher real interest rates. Image: The Daily Shot

Nasdaq 100 vs. 10-Year U.S. TIPS Yield (Inverted) The Nasdaq 100 has shown strong performance despite the rise in real yields, which may indicate the possibility of the market overheating. Image: The Daily Shot
TIPS Flows TIPS saw inflows for the first time since August 2022. Image: BofA Global Research
Real Gold Price vs U.S. 10-Year TIPS The relationship between gold and real yields has been evolving over time. Image: Morgan Stanley Research
10-Year TIPS Yield Inverted (U.S. Real Rates) vs. Gold Rising real yields did not have a major impact on the price of gold in 2022. Image: The Daily Shot
Valuation – Nasdaq 100 Relative to S&P 500 vs. U.S. 10-Year TIPS Yield Historically, it’s good for the U.S. stock market if U.S. real yields remain modestly positive. Image: Goldman Sachs Global Investment Research
Performance – FAAMGM Stocks over S&P 500 Index vs. 10-Year U.S. TIPS Yield (Inverted) Will FAAMGM stocks continue to underperform the S&P 500 Index? Image: Morgan Stanley Wealth Management
Gold Price vs. U.S. 5-Year TIPS Yield Generally, when the U.S. 5-year TIPS yield goes up, gold tends to go down. Image: The Daily Shot
U.S. 10-Year Yield and U.S. 10-Year TIPS Breakeven So far, the U.S. 10-year yield and the U.S. 10-year TIPS breakeven continue to follow the historical pattern after global recoveries. Image: Arbor Research & Trading LLC
Inflation – Real Estate Real Dividend Yield vs. TIPS Real Yield Real estate real dividend yields remain attractive relative to TIPS real yields. Image: BofA US Equity & Quant Strategy