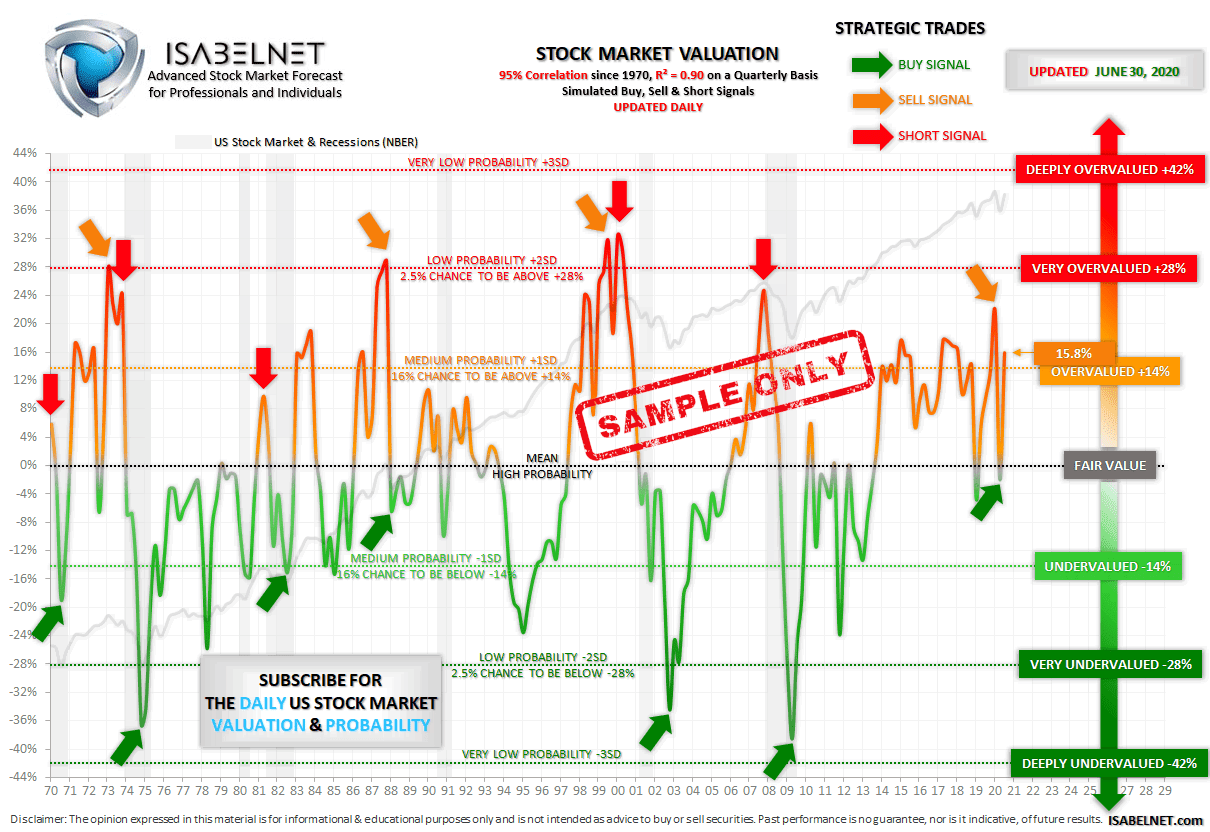
This powerful model looks into the US stock market and alerts if it is overvalued or undervalued
The model shows the valuation percentage to the right and to the left.
In the middle, it shows what the probability of each event happening is. Probability is a way to show how often an event will happen.
In gray, it displays the US stock market and recessions from the National Bureau of Economic Research. The S&P 500 is certainly the best-known proxy for the US stock market because it captures 80% of the market capitalization.
The US stock market is at fair value when it crosses the dark line. This is the mean and a high probability. When the US stock market hits the orange line, it is overvalued by 14%. There is a 16% chance on a quarterly basis that the US stock market valuation will be above 14% or one standard deviation. It is a medium probability. And when the US stock market hits the red line, it is very overvalued by 28%. There is a 2.5% chance on a quarterly basis that the US stock market valuation will be above 28% or two standard deviations. So, it is a low probability.
When the US stock market hits the light-green line, it is undervalued by -14%. There is a 16% chance on a quarterly basis that the US stock market valuation will be below -14% or one standard deviation. Again, it is a medium probability. And when the US stock market hits the green line, it is very undervalued by -28%. There is a 2.5% chance on a quarterly basis that the US stock market valuation will be below -28% or two standard deviations. So again, it is a low probability.
This advanced model was a perfect indicator of an expensive stock market, in 1973 during the Nifty Fifty stock bubble, in 1981 before the recession, in 1983, and in 1987 before the stock market crash, also known as Black Monday. It was also an excellent indicator of an expensive stock market, from 1998 to 2000 during the internet bubble, and in 2007 during the housing bubble before the Great Recession, and finally in 2015, and in 2018 before the market crash.
In the opposite direction, the model was a precise predictor of a cheap stock market in 1974 during the recession, in 1978, in 1980 and 1982 during the recession, and in 1985. It was also a superb predictor of a cheap stock market in 1990 during the recession, in 1995, in 2002 after the internet bubble, in 2009 after the housing bubble, and finally in 2011 and 2013 during the European debt crisis.
As an example: in 2007, the US stock market was very overvalued by 28%. There is a 2.5% chance on a quarterly basis that the US stock market valuation will be above 28% or two standard deviations. So, it was a low probability.
Another example: in 2009, the US stock market was very undervalued by 38%. There is a 2.5% chance on a quarterly basis that the US stock market valuation will be below -38% or two standard deviations. So again, it was a low probability.
When the stock market is very overvalued before a recession, then it is usually very undervalued after a recession, because of bubbles and high levels of debt.
Here are three examples:
– In 1973 before the recession, the US stock market was very overvalued by more than 28%. Then during the recession in 1974, it was very undervalued by more than -36%.
– In 2000 during the internet bubble, the US stock market was very overvalued by more than 33% before the recession. Then in 2002, after the recession and the internet bubble collapse, it was very undervalued by more than -34%.
– Finally, in 2007 during the housing bubble, the US stock market was very overvalued by more than 28% before the recession. Then in 2009, during the recession and the housing bubble collapse, it was undervalued by more than -37%.
This fantastic valuation model is updated daily, with strategic trades. It has a great 95% correlation with the US stock market on a quarterly basis since 1970 and an R² of 0.90. It means that 90 percent of the US stock market variance is predictable by the flows of data used.
By using this formidable decision support tool, you will empower yourself to make much better investment decisions.