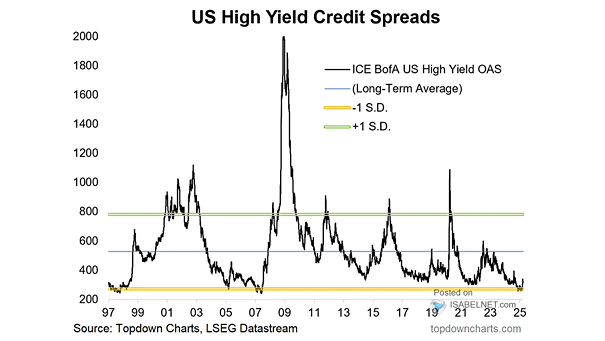
U.S. High Yield Corporate Bond Spreads
U.S. High Yield Corporate Bond Spreads While tight high-yield credit spreads reflect strong market confidence, they also warrant caution as they may mask underlying vulnerabilities and investor complacency. Therefore, vigilant monitoring of credit spreads is essential. Image: Topdown Charts