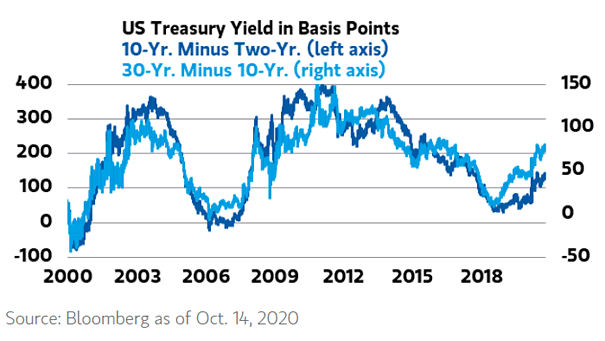
U.S. Treasury Yield – 10Y-2Y vs. 30Y-10Y
U.S. Treasury Yield – 10Y-2Y vs. 30Y-10Y Morgan Stanley forecasts the 10-year Treasury yield at about 1% by the end of the year. Image: Morgan Stanley Wealth Management
U.S. Treasury Yield – 10Y-2Y vs. 30Y-10Y Morgan Stanley forecasts the 10-year Treasury yield at about 1% by the end of the year. Image: Morgan Stanley Wealth Management
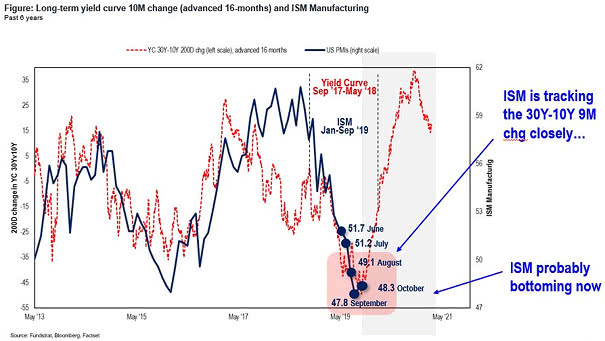
200D Change in Yield Curve 30Y-10Y Leads U.S. ISM Manufacturing Index This great chart suggests that 200-Day Change in Yield Curve 30-Year minus 10-Year spread leads U.S. ISM Manufacturing Index by 16 months. It also suggests that U.S. PMI is probably bottoming now and could bounce back. Image: Fundstrat Global Advisors, LLC

Cyclical Stocks Responding to Steepening Long-term Yield Curve Keep in mind that the Fed has little influence on the long end of the yield curve. And currently, the 30-year Treasury rate minus 10-year Treasury rate spread has a normal upward slope, like in the mid-1990s when the economy was growing. The chart below shows that the…