S&P 500 Seasonality Since 1985

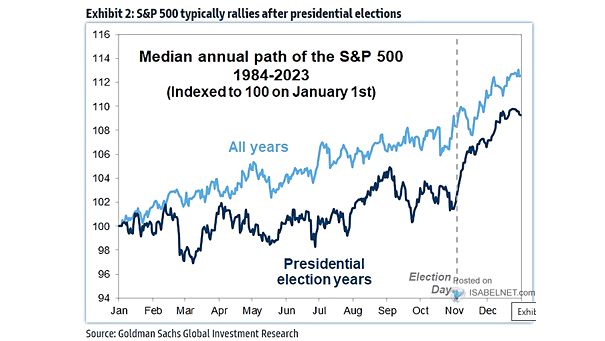
S&P 500 Seasonality Since 1985 Chart showing the S&P 500 seasonality from 1985 to 2019. This is not a forecast. Image: Goldman Sachs Global Investment Research

S&P 500 Seasonality

S&P 500 Seasonality Should investors “sell in May and go away” this year? Image: Nordea and Macrobond

S&P 500 Seasonality

S&P 500 Seasonality Chart showing the S&P 500 seasonality from 1985 to 2018 (excluding 2008). This is not a forecast. Image: Goldman Sachs

VIX and S&P 500 Seasonality

VIX and S&P 500 Seasonality The chart shows the seasonality map for the VIX and the S&P 500, and how they move in opposite directions. Image: Topdown Charts

Nasdaq 100 and S&P 500 Seasonality

Nasdaq 100 and S&P 500 Seasonality The Nasdaq 100 and S&P 500 seasonality chart from 1985 to 2018 (excluding 2008). This is not a forecast. Image: Goldman Sachs