Seasonality – S&P 500 Index Average Monthly Returns

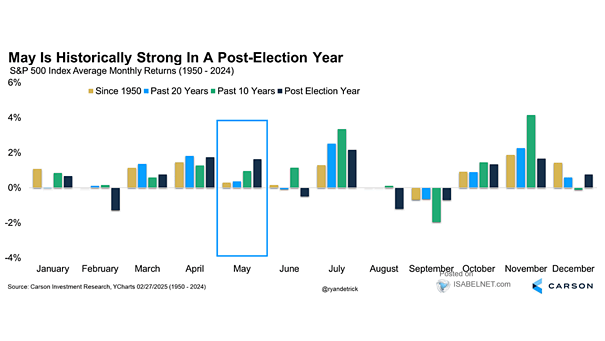
Seasonality – S&P 500 Index Average Monthly Returns Bulls have reason to smile: historically, July has been the best month in post-election years and over the past 20 years. This suggests there is further upside potential ahead. Image: Carson Investment Research
Seasonality – S&P 500 Index Returns in June

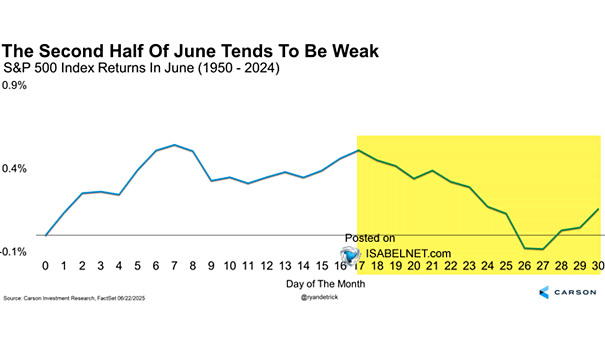
Seasonality – S&P 500 Index Returns in June Historically, the U.S. stock market often weakens—and even posts negative returns—in the latter half of June. Could this time be different? Image: Carson Investment Research

Seasonality – Monthly Return Stats for the S&P 500

Seasonality – Monthly Return Stats for the S&P 500 Historically, when May sees strong gains—over 5%—it often paves the way for continued positive sentiment and solid returns in June, especially when economic and monetary conditions are favorable. Image: Topdown Charts

Seasonality – S&P 500 Returns in March

Seasonality – S&P 500 Returns in March Since 1950, the second half of March has tended to be favorable for U.S. stocks. This historical pattern, combined with the fact that March marks the end of the first quarter, gives bulls reasons to be optimistic. Image: Carson Investment Research

Seasonality – S&P 500 Index Performance Post-Election Years

Seasonality – S&P 500 Index Performance Post-Election Years Since 1950, the U.S. stock market has historically shown strong performance in March, April, and May during post-election years, offering bulls reasons for optimism. Image: Carson Investment Research

Seasonality – S&P 500 Monthly Returns

Seasonality – S&P 500 Monthly Returns The performance of the U.S. stock market in January is often considered as a key indicator for the year ahead. Although January’s stock returns can seem erratic, the median return has been around 1.5% since 1950. Image: Goldman Sachs Global Investment Research

Seasonality – S&P 500 Index Returns in December

Seasonality – S&P 500 Index Returns in December Bulls are buzzing with excitement again! While December is typically strong for U.S. stocks, the best may be yet to come, as the majority of gains usually occur in the month’s second half. Image: Carson Investment Research

S&P 500 3-Month Seasonality Returns

S&P 500 3-Month Seasonality Returns Will the U.S. stock market keep investors smiling? The three-month period of November through January has traditionally been the strongest for U.S. stock market performance. Image: Carson Investment Research

Seasonality – Average Daily Performance of the S&P 500

Seasonality – Average Daily Performance of the S&P 500 Although the S&P 500 benefits from robust earnings growth and positive expectations for monetary policy, U.S. stocks often experience weakness in September and October. Image: Deutsche Bank

Seasonality – Average Annualized S&P 500 Price Return by Month

Seasonality – Average Annualized S&P 500 Price Return by Month BofA’s strategists are cautioning investors about the potential for significant market corrections in the near term, driven by weak seasonal patterns and the uncertainties surrounding the U.S. election. Image: BofA US Equity & Quant Strategy