Distribution of Forward Returns by 200MA Slope
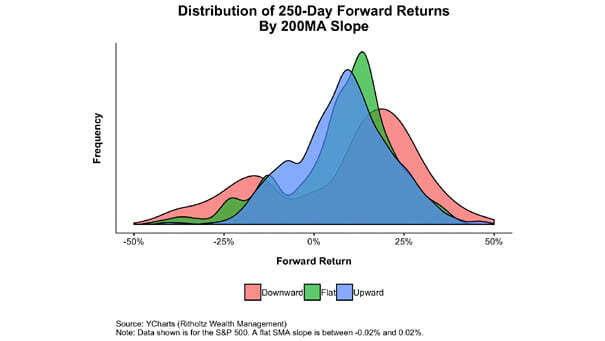
Distribution of Forward Returns by 200MA Slope This great chart shows the distribution of forward returns when the slope of S&P 500’s 200-day moving average is lower, flat or higher. Image: Ritholtz Wealth Management