Global GDP Growth Outlook – Trade Tensions vs. Policy Easing
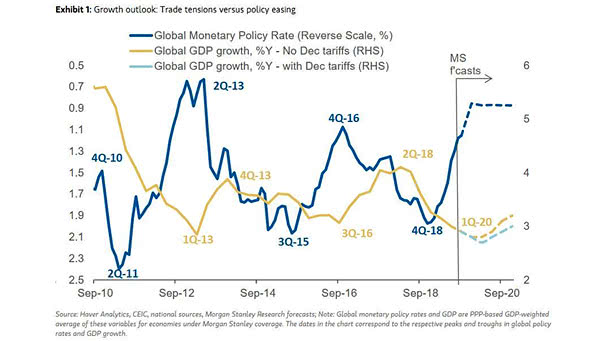
Global GDP Growth Outlook – Trade Tensions vs. Policy Easing The escalation of trade tensions is a risk to the global economy outlook. Image: Morgan Stanley Research
Why Trade Tensions Are Not Driving the U.S. Stock Market? Because many Unicorns are going public in the United States this year. Secondly, U.S. banks are healthier than ever and liquidity conditions are quite good in the U.S.. So all in all, that’s far more important than trade tensions. Image: Bloomberg
BlackRock Geopolitical Risk Indicator for Global Trade Tensions The recent decline of the indicator suggests that investors may be more complacent about the risk and impact of trade conflicts. Source: BlackRock Investment Institute – Global Investment Outlook Q2 2019
Global Trade Volume Chart showing weaker global trade volumes amid trade tensions. Image: Financial Times
Central Bank Reserve Holdings of Gold For the first time since the end of WWII, central banks are increasing their holdings of gold to diversify their reserves away from the U.S. dollar, amid trade tensions. Image: Bernstein
Liquidity Premium and IG Bonds The spread between low liquid and high liquid IG bonds is widening, despite the rally and the belief of an improvement in US-China trade tensions. Image: Goldman Sachs Global Investment Research
China’s Global Acquisitions Global acquisitions by Chinese companies continue to fall, due to tight credit conditions and US-China trade tensions. Image: Financial Times
Buybacks Are the Source of the Rally in the Stock Market since 2009 But as trade tensions and economic slowdown worry U.S. firms, stock buybacks declined last quarter. Image: Deutsche Bank Global Research
S&P 500 Share Buybacks by Quarter Share buybacks have contracted for the first time since 2017, as trade tensions and economic slowdown worry U.S. firms. Image: The Wall Street Journal
ISM Manufacturing Index vs. ISM Non-Manufacturing Index ISM Non-Manufacturing rises to 56.9. That’s good news despite US-China trade tensions and weak global growth. When ISM Manufacturing PMI and ISM Non-Manufacturing PMI are below 50, as in 2001 and 2008, there is a recession.But when there is a divergence, as in 2016 and today, it doesn’t…