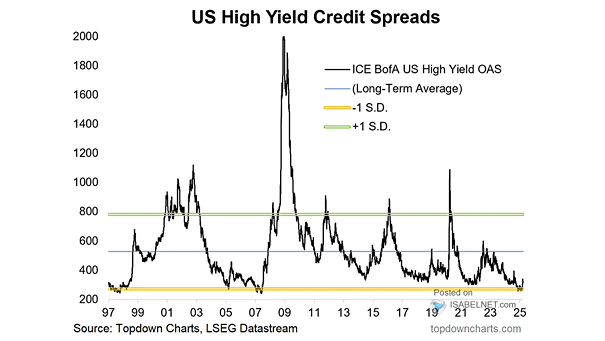
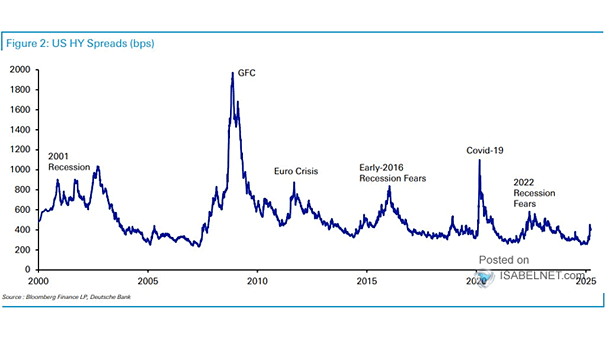
Corporate High Yield Bond Index
Corporate High Yield Bond Index With high yield investors piling into risky debt, CCC spreads have collapsed the most over the past nine months. Image: Morgan Stanley Wealth Management
Performance – Dow Jones High Yield Select 10 Index Relative to S&P 500 The Dogs of the Dow (10 highest yielding stocks in the Dow Jones) tend to outperform the S&P 500 after recessions. Image: Financial Times
Coronavirus – EM High Yield Spread The coronavirus pandemic has left credit spreads at distressed levels for a number of EM high-yield sovereigns. Image: Goldman Sachs Global Investment Research
Weekly High Yield Fund Flows This week, high-yield fund flows remain positive. Image: BofA Global Research
U.S. Energy Stocks vs. U.S. High Yield Energy Bonds U.S. energy stocks are historically cheap. Will the gap be closed? Image: BofA Global Investment Strategy
High Yield Spread vs. U.S. Default Rate Current high yield spreads are predicting decline in U.S. default rates. Image: BofA Global Investment Strategy
U.S. Corporate High Yield Bond Spreads A breakthrough in the 200-day moving average has historically been bullish for high yield. Image: Morgan Stanley Wealth Management
Drawdowns – S&P 500 vs. High Yield The high-yield sector has been relatively resilient during the recent drawdown episode. Image: Fidelity Investments
High Yield Volatility High yield volatility is likely to remain elevated from economic weakness. Image: Morgan Stanley Research
U.S. High Yield Spreads vs. IG Spreads and Large Cap Growth Relative to Small Cap Value This chart suggests that new highs in stocks need high yield outperformance and sustained rotation from large cap growth to small cap value. Image: BofA Global Investment Strategy