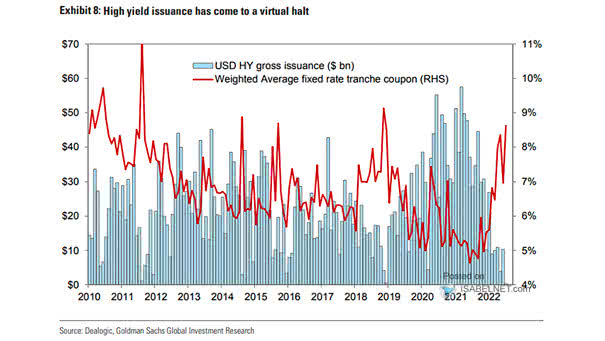
USD High Yield Gross Issuance
USD High Yield Gross Issuance Rising interest rates do not bode well for high yield issuance. Image: Goldman Sachs Global Investment Research
USD High Yield Gross Issuance Rising interest rates do not bode well for high yield issuance. Image: Goldman Sachs Global Investment Research
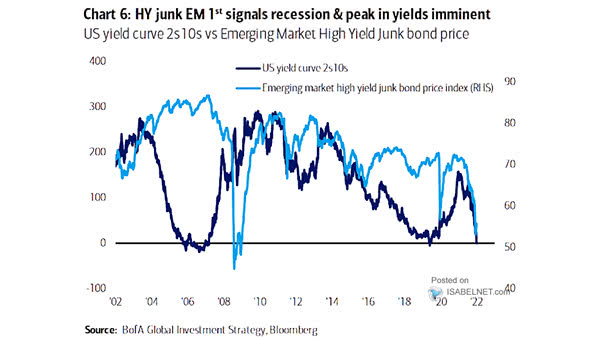
U.S. Yield Curve 2s10s vs. Emerging Market High Yield Junk Bond Price Is a recession looming and are peak yields imminent? Image: BofA Global Investment Strategy

S&P 500 Index Operating Margin and U.S. Corporate High Yield Index High yield bonds may suggest a decline in corporate operating margins. Image: Morgan Stanley Wealth Management
S&P 500 – USD Liquid Grade Index and USD Liquid High Yield Index Could the S&P 500 break below the 4200 level? Image: BofA Global Research
High Yield Bonds – 12-Month Cumulative Volume of Rising Stars Minus Fallen Angels BofA forecasts a total return of 4-5% for U.S. high-yield bonds in 2022. Image: BofA Global Research
Equities – MSCI ACWI Total Return vs. U.S. High Yield/High Grade Total Return Relative Is credit a bearish sign for global equities? Image: BofA Global Investment Strategy
Weekly Sum of Flows into High Grade, High Yield, Equity and EM Debt Funds Are outflows from risky assets temporary? Image: BofA ETF Research
U.S. Corporate High Yield Bonds and U.S. CPI Currently, U.S. high yield bonds no longer compensate for U.S. inflation. Image: Morgan Stanley Wealth Management
U.S. High Yield – % $HY Negative Real Yield How long will U.S. junk bonds with negative real yields last? Image: Deutsche Bank
U.S. Equity Implied Volatility and Credit High Yield Spreads U.S. equity implied volatility remains at relatively high levels. Image: Goldman Sachs Global Investment Research
S&P 500 Index and U.S. Corporate High Yield Index Is high yield credit a bearish sign for the S&P 500? Image: Morgan Stanley Wealth Management