Search Results for: world debt
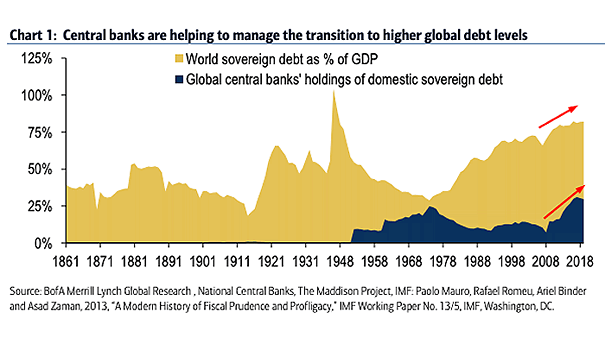
World Sovereign Debt and Global Central Banks’ Holdings of Domestic Sovereign Debt
World Sovereign Debt and Global Central Banks’ Holdings of Domestic Sovereign Debt Central Banks now own a high percentage of all global sovereign debt, leading to higher debt levels in coming years. Image: BofA Merrill Lynch Global Research

U.S. Household Debt and World Trade
U.S. Household Debt and World Trade This chart shows the pretty good correlation between U.S. household debt and world trade. Image: Oxford Economics, Macrobond
World – Gross Government Debt as Percentage of GDP
World – Gross Government Debt as Percentage of GDP A look at gross government debt in 2019. Image: IMF
The World Has $13 Trillion of Debt With Negative Yields
The World Has $13 Trillion of Debt With Negative Yields But there are still positive-yield bonds. Image: The Wall Street Journal
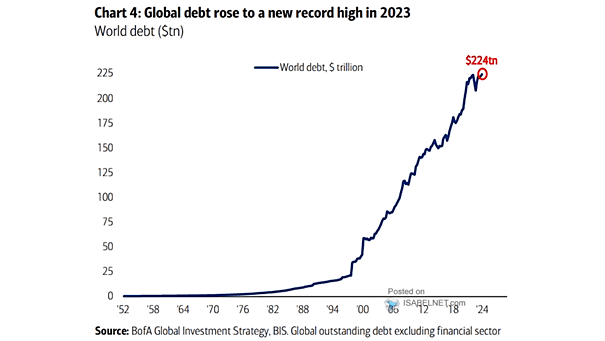
Global Government Debt
Global Government Debt Global government debt has skyrocketed since the global financial crisis, reaching its highest level in peacetime and posing significant challenges and vulnerabilities for governments and economies worldwide. Image: BofA Global Investment Strategy
Advanced Economies Debt/GDP
Advanced Economies Debt/GDP The coronavirus pandemic could bring the debt-to-GDP ratio of advanced economies to World War II levels. Image: Deutsche Bank
Debt, Demographics and Labor Force Growth
Debt, Demographics and Labor Force Growth The slowdown in the labor force in the U.S., China, Europe and Japan, represents 62% of the world’s GDP and 69% of the equity market capitalization. The labor force growth is expected to be -1% by 2055. Image: Fidelity Investments
Private Debt Assets Under Management
Private Debt Assets Under Management Private debt assets under management have tripled over the past decade to $812 billion. Investors are looking to increase yield in a world of low interest rates. Image: Goldman Sachs Global Investment Research
Household Debt to GDP by Country
Household Debt to GDP by Country This chart shows a global view of household debt as a percent of GDP. Households of Australia, Netherlands and Canada are the most indebted in the world. Image: Oxford Economics
Total Global Debt to GDP
Total Global Debt to GDP The global debt-to-GDP ratio is hovering near a record at $244 trillion. That’s now more than three times the size of the world economy. Image: Deutsche Bank Global Research