Stock Market Forecasting Models vs. US Stock Market - Growth of $1,000
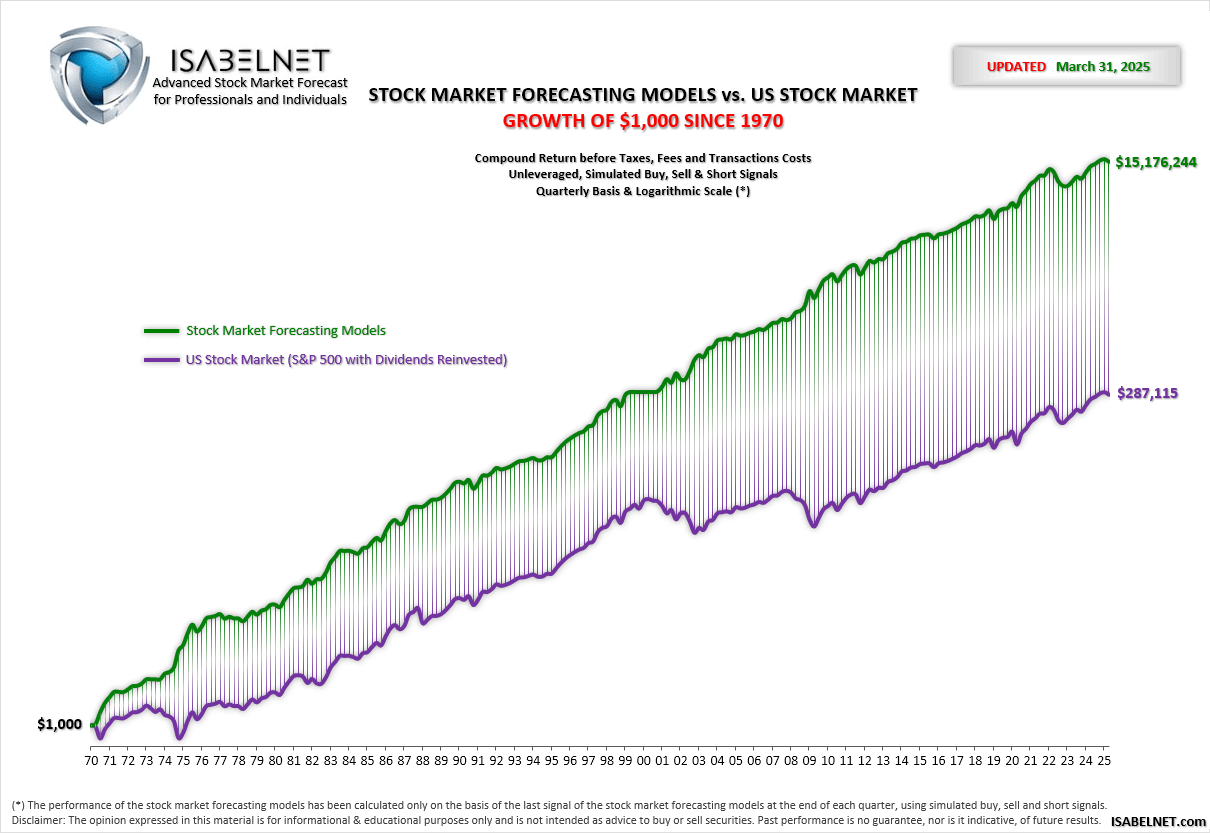
As an example, the chart shows the growth of $1,000 since 1970, between the stock market forecasting models and the US stock market (compound return before taxes, fees and transactions costs – unleveraged, simulated buy, sell & short signals – quarterly basis & logarithmic scale).
Academics and researchers use the S&P 500 with dividends reinvested as a proxy of the US stock market to perform statistical and pattern studies.