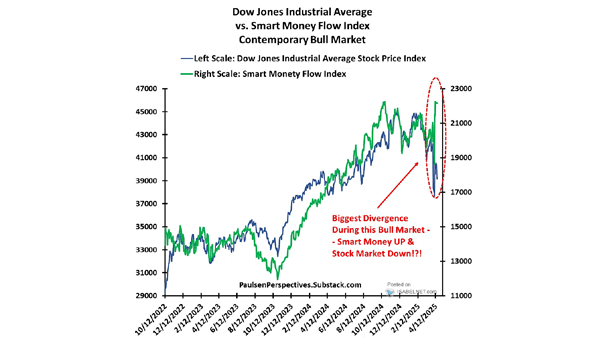
Cyclical Stocks – PMI YoY Change and Industrials vs. Market
Cyclical Stocks – PMI YoY Change and Industrials vs. Market Will cyclical stocks lead markets higher as the economy recovers? Image: Morgan Stanley Wealth Management
China – Industrialization Level and Urbanization Level China continues to rise as an industrial power. Image: BCA Research
Performance – Banks, Industrials, Materials and Energy Relative to S&P 500 Pandemic losers are the winners year-to-date, as the rotation remains intact. Image: Alpine Macro
Valuation – Dow Jones Industrial Average from 1921 to 1954 It took the Dow Jones 25 years to regain its 1929 highs. Is the U.S. stock market currently in bubble territory? Image: Financial Times
China Real GDP and Industrial Production China is experiencing a strong V-shaped economic recovery from the coronavirus pandemic. Image: BofA Global Investment Strategy
Dow Jones Industrial Average vs. S&P 500 The Dow Jone Industrial Average is lagging the S&P 500, as it is underweight in technology and overweight in financials and industrials. Image: CNBC
Secular Bull Market – Dow Jones Industrial Average and 30-Year Bond Cycles Chart suggesting a “new” secular bull market underway with the potential to last until 2034. Image: Fundstrat Global Advisors, LLC
Performance – Industrials vs. S&P 500 and Global Current Activity Indicator (CAI) Goldman Sachs upgraded industrials to outperform, as global economic growth is improving. Image: Goldman Sachs Global Investment Research
Dow Jones Industrial Average – Present vs. 1930 This chart compares the Dow Jones Industrial Average to 1930 (for informational purposes only). Image: Nautilus Research
Bloomberg Dollar Index vs. U.S. Industrials ETF A rebound in activity could suggest a further depreciation of the U.S. dollar. Image: Goldman Sachs Global Investment Research