Cumulative Performance of a 60/40 Portfolio
Cumulative Performance of a 60/40 Portfolio There are concerns that a 60/40 portfolio is potentially facing another “lost decade.” Image: BofA Research Investment Committee
Performance – Dow Jones Industrial Average vs. Nasdaq Will the Nasdaq continue to track the 1972-75 Dow Jones Industrial Average analog? Image: BofA Global Investment Strategy
Performance – U.S. Outperformance vs. Global Ex-U.S. Outperformance Should U.S. investors favor international equities over U.S. equities? Image: BofA Research Investment Committee
Performance – U.S. vs. Global ex-U.S. Should investors overweight global ex-U.S. equities in their portfolio over U.S. equities? Image: BofA Research Investment Committee
Relative Performance of Prior Bull Market Leader vs. The Next Bull Market Leader Should investors continue to overweight the energy sector over the tech sector? Image: BofA US Equity & Quant Strategy
Average S&P 500 Performance in Fed Tightening Cycles S&P 500 weakness tends to materialise 9-10 months after the first Fed rate hike and tends to last a year. Image: Deutsche Bank
Risk Appetite and Expected U.S. Equity Market Performance
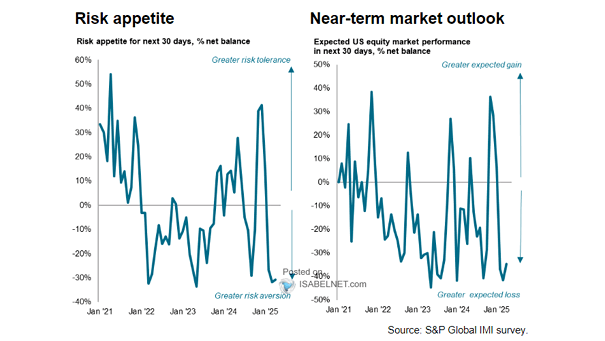
 The risk appetite of U.S. equity investors is still negative. Image: S&P Global Market Intelligence
Annual 60/40 Portfolio Performance Will the 60/40 portfolio continue to perform well in 2023? Image: BofA Global Investment Strategy
Energy vs. S&P 500, Relative Price Performance Will the energy sector continue to outperform the S&P 500? Image: BofA Global Investment Strategy
Performance – World Technology vs. Healthcare Is it the end of the FAANG bubble? Image: BCA Research