The S&P 500’s Lack of Diversification – S&P 5 vs. S&P 495
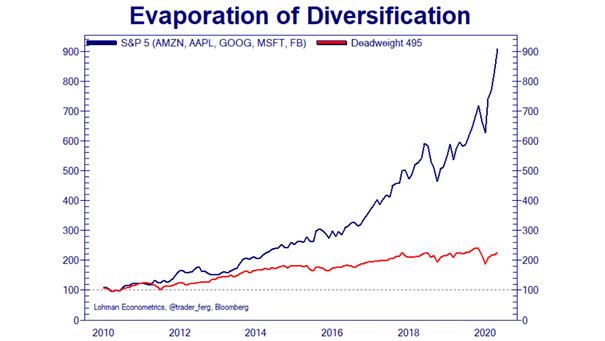
The S&P 500’s Lack of Diversification – S&P 5 vs. S&P 495 As this chart hightlights, the S&P 500 is less diversified than you think. Image: Lohman Econometrics
The S&P 500’s Lack of Diversification – S&P 5 vs. S&P 495 As this chart hightlights, the S&P 500 is less diversified than you think. Image: Lohman Econometrics
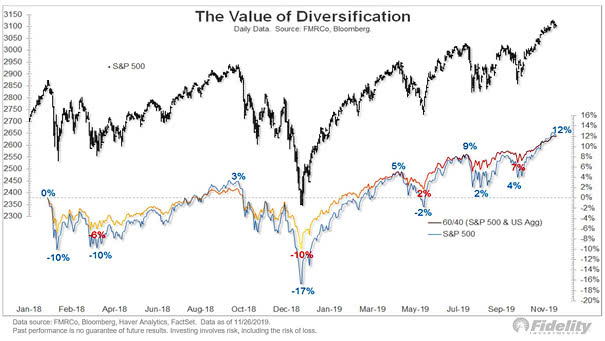
The Value of Diversification – 60/40 Portfolio vs. S&P 500 This chart shows the return and volatility of a 60/40 portfolio vs. S&P 500. Image: Fidelity Investments

Time, Diversification and the Volatility of Returns This chart shows how the volatility of returns decreases over time (range of equity, bond and blended total return). Picture Source: J.P. Morgan Asset Management
Equity Market Concentration – Market Capitalization of 10 Largest Companies as Share of S&P 500 Total The S&P 500’s top 10 stocks hold a disproportionately large share of the index’s weight relative to their earnings, which amplifies risks tied to volatility, diversification, and sector exposure. Image: Goldman Sachs Global Investment Research
Total Known ETF Holdings of Gold Over the past three weeks, gold ETFs have seen net outflows as investors took profits after a major price rally. However, investor interest in gold remains strong for diversification and as a hedge against uncertainty. Image: J.P. Morgan
Equities – MSCI U.S./RoW Distance from 200-DMA The MSCI U.S./RoW distance from the 200-DMA highlights a major interruption to the narrative of U.S. exceptionalism and reinforces the need for global diversification in equity portfolios. Image: Bloomberg
Valuation – PE10 Ratio USA vs. Rest of the World Investors seeking diversification and long-term growth may prefer emerging markets and non-U.S. developed markets over U.S. stocks due to their attractive valuations. Image: Topdown Charts
U.S. Share of Global Equity Market The U.S. share of the global equity market, while still dominant at 54%, has retreated from its peak of 57%, reflecting recent market turbulence and growing diversification concerns. Image: Goldman Sachs Global Investment Research
S&P 500 Dividend Payers / Non-Payers Ratio Amidst 2025’s market volatility, dividend stocks emerge as a compelling investment, offering both steady income and growth potential while serving as a robust tool for portfolio diversification. Image: Ned Davis Research
YTD Equity Return vs. U.S. In 2025, the relative outperformance of international stocks compared to U.S. equities has underscored the benefits of diversification for investors so far. Image: Goldman Sachs Global Investment Research
Top 10 Mega Cap Stocks as % of S&P 500 The increasing dominance of the top 10 companies in the S&P 500 Index has sparked significant concerns regarding the index’s ability to offer adequate diversification for investors. Image: Real Investment Advice