S&P 500 vs. ISM Composite PMI
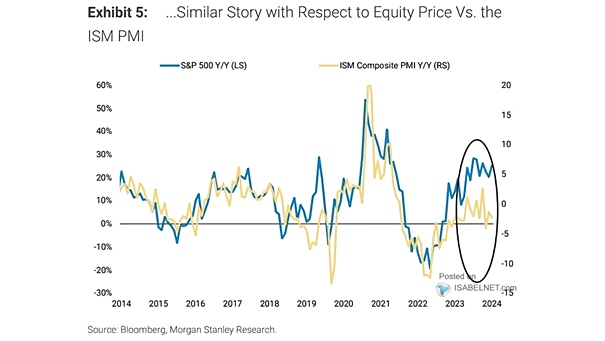
S&P 500 vs. ISM Composite PMI It is common during the late stage of an economic cycle for the S&P 500 to outpace the ISM. Should investors favor defensive stocks, energy and industrials? Image: Morgan Stanley Research
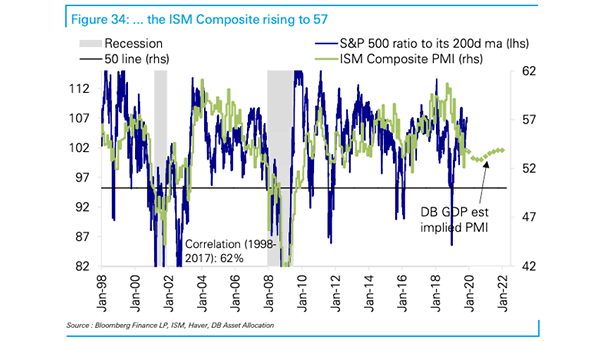
S&P 500 and ISM Composite PMI At current levels, the U.S. market is pricing in a strong rebound in the ISM Composite PMI rising to 57. Image: Deutsche Bank Asset Allocation
ISM Composite PMI vs. Crude Oil Interesting chart showing that the correlation between the ISM Composite PMI and crude oil is up to 75% since 2015. Image: Lohman Econometrics
U.S. ISM PMI Composite Index and U.S. Real GDP Chart showing the correlation between the U.S. ISM PMI Composite Index and U.S. real GDP. The service sector is still expanding. Image: Oxford Economics
ISM Manufacturing PMI and Global Stocks vs. Government Bonds In a potential shift from a “no” to a “hard” landing scenario, government bonds may outperform due to increased risk aversion, interest rate cuts, lower inflation expectations, and their historical performance during economic downturns. Image: BofA Global Investment Strategy