U.S. Stock Market Bull and Bear Indicator

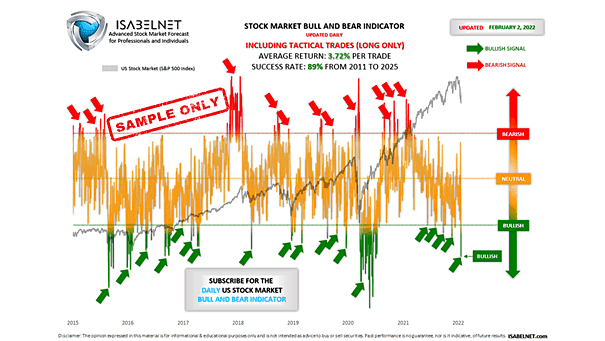
U.S. Stock Market Bull and Bear Indicator Using multiple financial data, this great model helps investors navigate through different market conditions. It suggests whether the U.S. stock market tendency is bullish, bearish or neutral. It is a contrarian indicator. A bullish signal suggests that the U.S. stock market may go up, while a bearish signal…
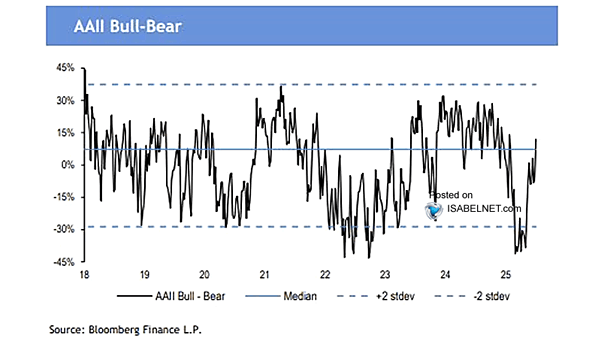
AAII U.S. Investor Sentiment Bearish Readings

AAII U.S. Investor Sentiment Bearish Readings While AAII U.S. investor pessimism has eased to a 20-week low, bearish sentiment remains modestly elevated relative to historical averages, indicating that caution lingers even as market conditions improve. Image: The Daily Shot

S&P 500 Performance After at Least 15 Weeks of AAII Bears over Bulls Ends

S&P 500 Performance After at Least 15 Weeks of AAII Bears over Bulls Ends A streak of 15 consecutive weeks with more bears than bulls in the AAII survey is rare—only four other periods have lasted this long. In each case, the S&P 500 was higher 12 months later, with an average gain of 27.5%.…

Bear Market Rallies

Bear Market Rallies Since 1980, global bear market rallies have averaged 44 days with 14% gains. Prices have already rebounded 18% from the April 7 low. For a sustained recovery, a stronger economic outlook and supportive policies are needed. Image: Bloomberg

S&P 500 Performance Recovering 50% of Bear Market

S&P 500 Performance Recovering 50% of Bear Market With the S&P 500 regaining half of its near-bear market losses in 2025, history strongly suggests that the lows may already be behind us. Since 1950, the S&P 500 has always produced positive returns one year later. Image: Carson Investment Research

S&P 500 Corrections and Bear Markets Since World War II

S&P 500 Corrections and Bear Markets Since World War II Corrections and bear markets, while inevitable and uncomfortable, often reset valuations—providing long-term investors a chance to reevaluate holdings and build positions at attractive levels. Image: Carson Investment Research

AAII U.S. Investor Sentiment Bearish Readings > 50

AAII U.S. Investor Sentiment Bearish Readings > 50 The current AAII U.S. Investor Sentiment Bearish reading of 58.9% marks the 7th consecutive week above 50%, aligning with the record streak observed in October 1990, which coincided with a major market low. Image: The Daily Shot

MSCI AC World – Bear Market Rallies

MSCI AC World – Bear Market Rallies Since the 1980s, there have been 19 global bear market rallies, lasting 44 days on average with MSCI AC World returns of 10–15%. Image: Goldman Sachs Global Investment Research

Different Type of Bear Markets

Different Type of Bear Markets While both cyclical and event-driven bear markets tend to drop by approximately 30%, their durations vary. Cyclical bear markets average two years, whereas event-driven ones last about eight months and recover within a year. Image: Goldman Sachs Global Investment Research