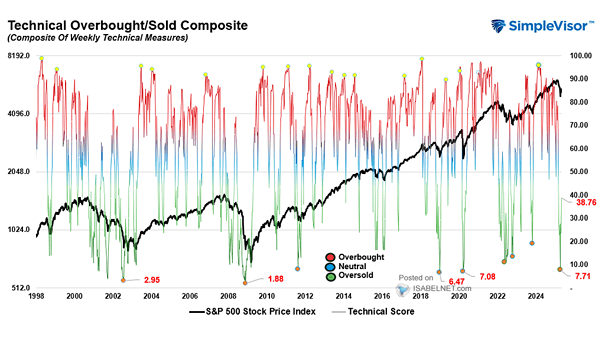
S&P 500 Index and Technical Score
S&P 500 Index and Technical Score The U.S. stock market, with a reading of 81.85, has entered overbought territory—usually a sign of excessive buying pressure—and may be due for some price consolidation soon. Image: Real Investment Advice