Global Employment and Global Real Retail Sales
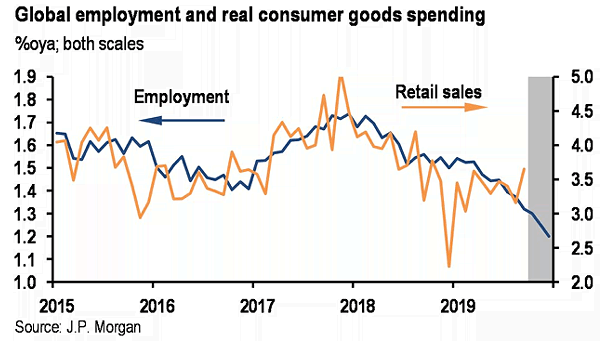
Global Employment and Global Real Retail Sales Chart suggesting that the slowdown in global employment is expected to impact global real retail sales. Image: J.P. Morgan
Global Employment and Global Real Retail Sales Chart suggesting that the slowdown in global employment is expected to impact global real retail sales. Image: J.P. Morgan
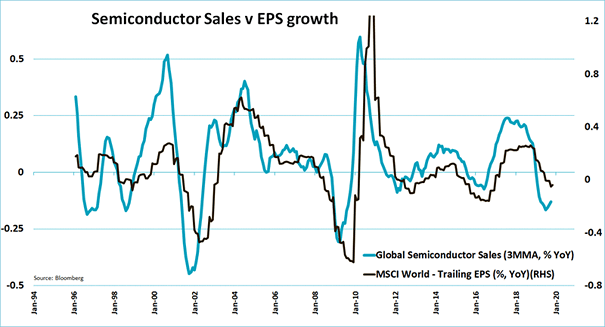
Global Semiconductor Sales vs. MSCI World EPS Growth Chart suggesting that global semiconductor sales may have bottomed. That’s good news for global EPS growth. Image: Jeroen Blokland

Global Corporate Bond Sales Companies sold a record amount of bonds in September. Yield-seeking investors were served up $434bn of new corporate bonds globally. Image: Financial Times
Global Semiconductor Sales Lead U.S. GDP Growth This interesting chart suggests that global semiconductor sales lead U.S. GDP growth by six months. Image: Nordea and Macrobond
Semiconductor Sales vs. Global Earnings per Share The chart shows that semiconductor sales suggest a collapse in corporate earnings. Image: Jeroen Blokland
Semiconductor Sales vs. Global Trade (volume) Interesting chart showing the correlation of 0.78 between semiconductor sales and global trade (volume). Image: Paolo Cardena
S&P 500 – Share of Sales Derived from Outside United States The S&P 493 (S&P 500 ex-Magnificent Seven) faces lower global trade risks than the Magnificent Seven, which rely on nearly 50% foreign sales. Image: Goldman Sachs Global Investment Research
S&P 500 Days Sales of Inventory The trough of the inventory de-stocking cycle often coincides with the beginning of a broader business recovery, characterized by rising demand, improved economic conditions, and increased production and sales. Image: BofA Global Research
G3 Real Core Retail Sales Since 2019, real core retail sales in the United States have risen significantly, while Germany has seen stagnant growth and Japan has witnessed a decline, reflecting differing economic conditions and consumer behaviors. Image: BofA Global Research
U.S. Labor Market – U.S. Nonfarm Payrolls vs. Retail Sales Higher payrolls can potentially lead to higher retail sales, as increased income for employees can result in greater purchasing power. Image: BofA Global Investment Strategy
U.S. Existing Home Sales High mortgage rates do not bode well for existing home sales in the United States. Image: BofA Global Research