U.S. Households’ (Incl. Hedge Fund) Asset Allocation
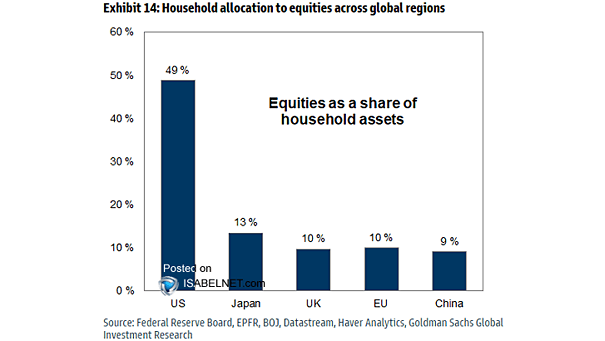
U.S. Households’ (Incl. Hedge Fund) Asset Allocation U.S. households are currently heavily overweight in equities relative to fixed income, reflecting strong conviction in U.S. equity markets despite ongoing economic uncertainties and cautious positioning in bonds. Image: Deutsche Bank