Nasdaq Composite – 2020 vs. 2025 Analog
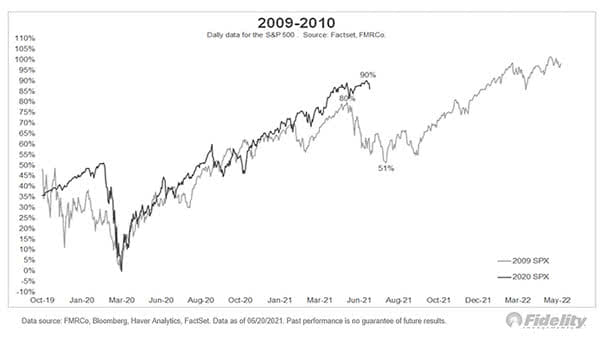
Nasdaq Composite – 2020 vs. 2025 Analog The Nasdaq’s 2025 market pattern mirrors the 2020 pandemic crash and recovery in terms of price movement and investor sentiment, reflecting resilience and a bullish trend. Image: Real Investment Advice