U.S. Labor Market and U.S. Output Gap
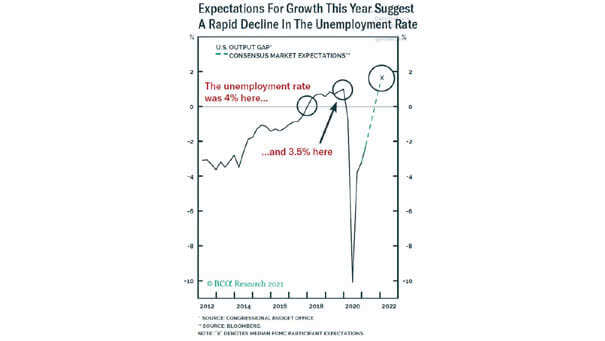
U.S. Labor Market and U.S. Output Gap Should investors expect a quick recovery in the U.S. labor market? Image: BCA Research
U.S. Labor Market and U.S. Output Gap Should investors expect a quick recovery in the U.S. labor market? Image: BCA Research
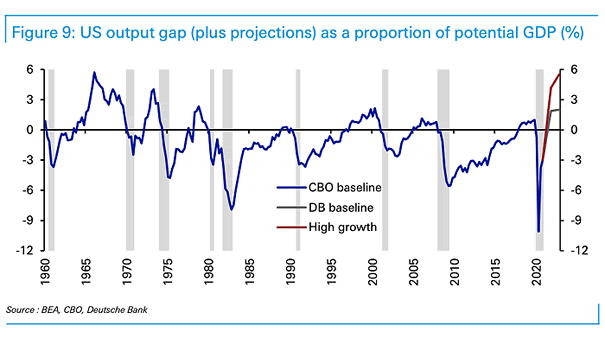
U.S. Output Gap (Plus Projections) as a Proportion of Potential GDP According to Deutsche Bank, the U.S. output gap is expected to rise above 2%, which tends to lead to higher prices. Image: Deutsche Bank

U.S. Output Gap (% of Potential GDP) Will the Fed take action to prevent the U.S. economy from overheating? Image: BofA Global Research
U.S. Output Gap as % of Potential GDP and U.S. Wage Growth (Leading Indicator) Chart suggesting that US output gap as % of potential GDP tends to lead US wage growth by one year. Image: Pictet Asset Management
U.S. Output Gap (% of potential GDP) and Inflation U.S. output gap (% of potential GDP) tends to lead underlying core PCE by 12 months. Image: Pictet Asset Management
U.S. Output Gap and Inflation This chart shows that actual U.S. GDP is higher than potential GDP. Historically, a positive output gap leads to inflation. Image: Richardson Wealth
Output Gap and Stages of the U.S. Business Cycle Despite gloomy headlines, this chart suggests that the U.S. economic expansion is still intact. Image: BlackRock Investment Institute
PCE Inflation vs. Output Gap (Leading Indicator) Positive output gap suggests higher core inflation next year. Image: NBF Economics and Strategy
U.S. Business Cycle: Output Gap vs. Core PCE Inflation The mature phase of the U.S. business cycle began 24 months ago. The mature phase lasted 72 months in the late 1960s and 57 months in the late 1990s. Image: NBF Economics and Strategy
Business Cycle – U.S. Output Gap and Unemployment Rate Chart suggesting that the US economy has slipped into the late stage of the business cycle. Image: Quill Intelligence, LLC
U.S. Output Gap vs. U.S. Consumer Confidence Great chart showing the strong correlation between U.S. consumer confidence and the U.S. Output Gap. U.S. consumer confidence always peaks before a recession. Image: Pictet Asset Management