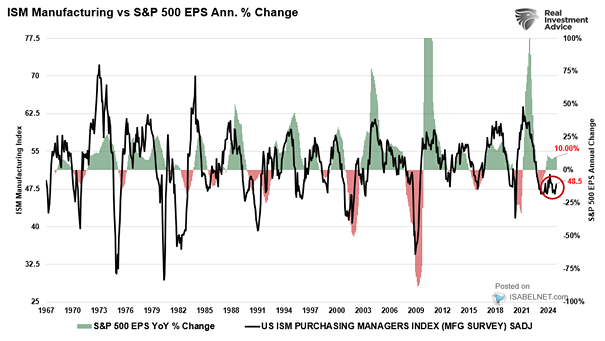
S&P 500 and Manufacturing PMI
S&P 500 and Manufacturing PMI Will PMIs continue to head lower and drive the S&P 500 down? Image: Morgan Stanley Research
ISM Manufacturing PMI vs. Cyclicals/Defensives Ratio Will the ISM Manufacturing PMI soon fall into contraction territory? Image: The Daily Shot
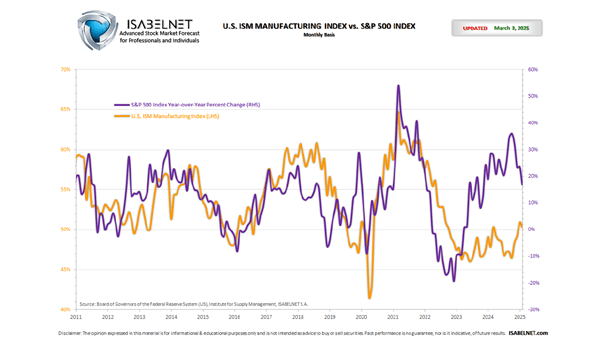
ISM Manufacturing Index vs. S&P 500 Index This chart shows the correlation between the ISM manufacturing index and the S&P 500 index year-over-year percent change, since 2011. The U.S. ISM Manufacturing Index decreased to 53% in June. Click the Image to Enlarge
ISM Manufacturing Index and Regional Manufacturing Surveys Regional manufacturing surveys do not bode well for the ISM Manufacturing Index. Image: True Insights
Central Banks – Global Monetary Policy Stimulus Leads Global Manufacturing PMI Global monetary policy stimulus tends to lead global manufacturing PMI by 8 months. Is a hard landing inevitable? Image: Topdown Charts
Equity Fund Flows vs. ISM Manufacturing Will equity fund inflows continue to slow as the U.S. economy decelerates? Image: Deutsche Bank Asset Allocation
ISM Manufacturing Index vs. S&P 500 Positive Sales Surprises Should U.S. equity investors expect small positive sales surprises ahead? Image: Morgan Stanley Wealth Management
ISM Manufacturing PMI vs. ISM New Orders – Inventories The ISM New Orders less Inventories tends to lead the ISM Manufacturing PMI by 3 months. Image: The Daily Shot
Inflation – U.S. Core CPI vs. ISM Manufacturing PMI (Leading Indicator) The U.S. ISM Manufacturing PMI tends to lead U.S. core CPI by 12 months. Image: BCA Research
S&P 500 Ratio to 200 DMA and ISM Manufacturing PMI The S&P 500 was pricing an ISM Manufacturing PMI of 40. Image: Deutsche Bank Asset Allocation