Demographics – U.S. Population Aging and Pension Demand for Bonds
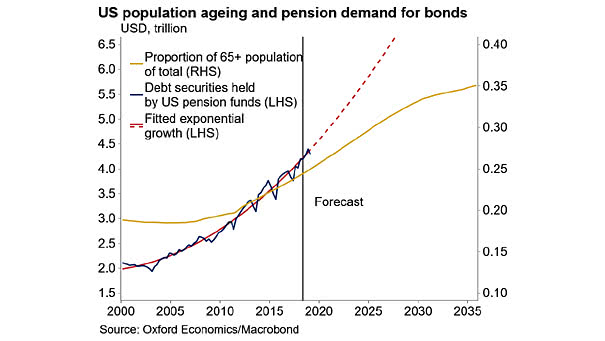
Demographics – U.S. Population Aging and Pension Demand for Bonds This chart suggests that U.S. pension demand for bonds is going to increase, as the proportion of 65+ rises. Image: Oxford Economics, Macrobond