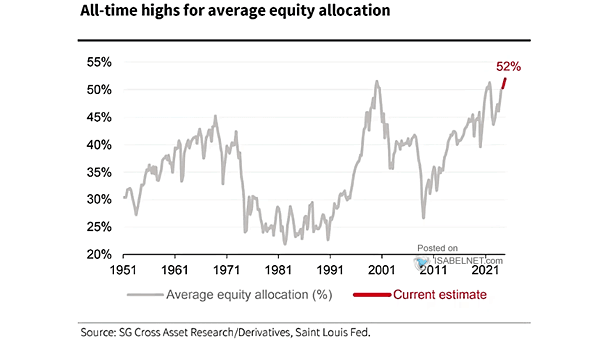
Equity – U.S. Households Aggregate Financial Asset Allocation
Equity – U.S. Households Aggregate Financial Asset Allocation U.S. households’ equity allocation remains high. Image: Goldman Sachs Global Investment Research
GWIM Cash Allocation as % Asset Under Management Cash allocation from BofA’s private clients remains below the long-term average. Image: BofA
GWIM Equity Allocation as % Assets Under Management Equity allocation from BofA’s private clients stands at 59%. Image: BofA
Average Recommended Allocation to Cash by Wall Street Strategists Cash may not be the wisest choice for long-term investments, but cash yields are currently at attractive levels. Image: BofA US Equity & Quant Strategy
FMS Tech Net Allocation Bye-bye tech? Tech net allocation fell to the lowest level since August 2006. Image: BofA Global Fund Manager Survey
Inflows to Equities vs. Allocations to Equities Despite the fact that FMS investors are very bearish equities, there is no capitulation yet. Image: BofA Global Investment Strategy
U.S. Household Equity Allocation Despite the recent sell-off, U.S. household equity allocations remain at a high level. Image: Deutsche Bank Asset Allocation
Stocks vs. Bonds – Relative Allocations Are investors too aggressively positioned in U.S. stocks relative to bonds? Image: Topdown Charts
Implied Allocations: Gold Miners Allocation to gold miners remains low. Should investors be bullish on gold miners as valuations are reasonable? Image: Topdown Charts
Equity – Aggregate Financial Asset Allocation Among Households, Mutual Funds, Pension Funds, and Foreign Investors Allocations to equities exceed the peak of the tech bubble. Will this end well? Image: Goldman Sachs Global Investment Research