Global Stocks – MSCI ACWI Index
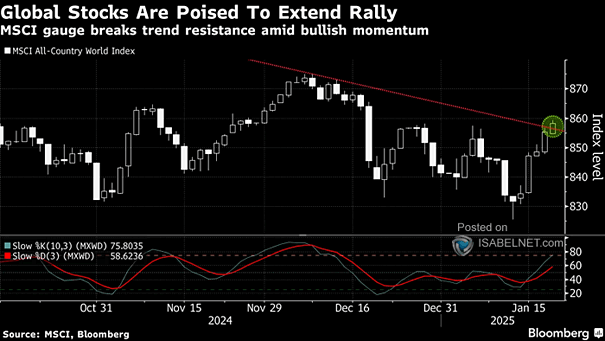
Global Stocks – MSCI ACWI Index Resilient economic data, a softer stance on tariffs, and optimism in technology sectors have driven global stocks to new highs, even as trade jitters persist. Image: Bloomberg
Global Stocks – MSCI ACWI Index Resilient economic data, a softer stance on tariffs, and optimism in technology sectors have driven global stocks to new highs, even as trade jitters persist. Image: Bloomberg
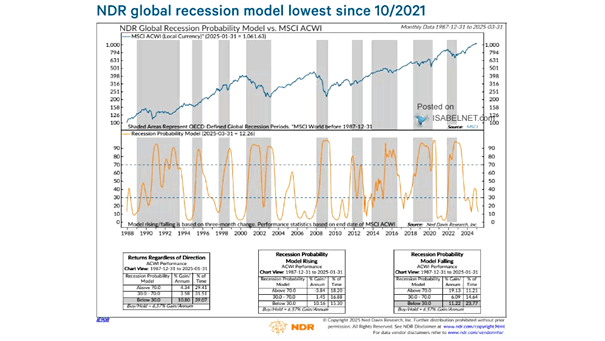
Global Recession Probability Model vs. MSCI ACWI NDR’s Global Recession Probability Model is at its lowest level in nearly four years, signaling a positive outlook for global equities. Image: Ned Davis Research

China as % of MSCI ACWI Market Capitalization Assuming that China’s market capitalization as a percentage of the MSCI ACWI rises to its 2018 high of 4.0%, this scenario presents a potential upside of approximately 30% for investors. Image: BofA Global Investment Strategy
Active Global Equity Fund Flows and % MSCI ACWI Members Trading Above 200-DMA Flows to active global equity funds correlate strongly with stock price dispersion. Higher dispersion creates more opportunities for active managers, especially in volatile markets, boosting investor interest and inflows. Image: BofA Global Investment Strategy
FMS Investors – Net % Expecting Stronger Economy vs. MSCI ACWI The increased optimism among FMS investors on global growth can be seen as a positive sign, potentially indicating a more favorable outlook. Image: BofA Global Fund Manager Survey
Performance – Global Equities Equal Weighted (MSCI ACWI Equal-Weighted Index) Since February 2020, the MSCI ACWI Equal-Weighted Index has done virtually nothing. Image: BofA Global Investment Strategy
Valuation – Price-to-Book Ratio – MSCI Japan Index vs MSCI ACWI ex Japan Index Warren Buffett’s positive view on Japanese stocks has raised the question of whether it is the right time to consider investing in them. Image: Morgan Stanley Wealth Management
Cumulative Global Equities Flows vs. MSCI ACWI Index Global equities just saw massive outflows of $17.5 billion. Image: BofA Global Investment Strategy
Global Equities – MSCI ACWI vs. ISM New Orders ISM new orders could suggest negative global equity returns. Image: BofA Global Investment Strategy
Global Equity Markets – MSCI ACWI Index with HY/IG Flows BofA sees a rates shock this year and remains bearish on equities and credit. Image: BofA Global Investment Strategy
Inflation – MSCI ACWI Energy vs. Consumer Discretionary Price Relative Historically, real assets tend to perform well in inflationary environments. Image: BofA Global Investment Strategy