Currency Impact on International Returns (MSCI ACWI ex-U.S.)
Currency Impact on International Returns (MSCI ACWI ex-U.S.) Chart showing the currency impact on the MSCI All Country World ex-U.S. Index. Image: J.P. Morgan Asset Management
MSCI ACWI ex-U.S. and S&P 500 Index U.S. equities have significantly outperformed the rest of the world in recent years, but this has not always been the case. You may also like “Trailing 12-month Return Differential between U.S. and non-U.S. Stocks.” Image: ClearBridge Investments
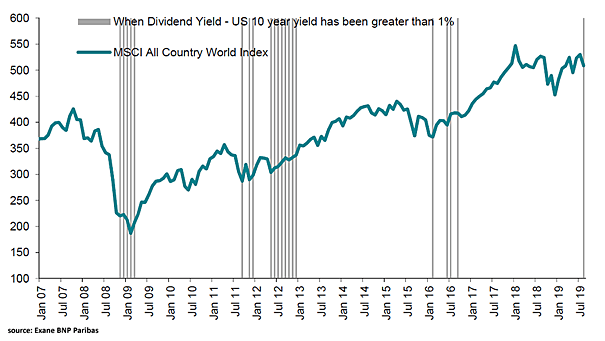
MSCI All Country World Index (ACWI) Dividend Yield Less U.S. 10-Year Yield When the spread has been greater than 1%, it has been a good support for the MSCI All Country World Index. Image: Exane BNP Paribas
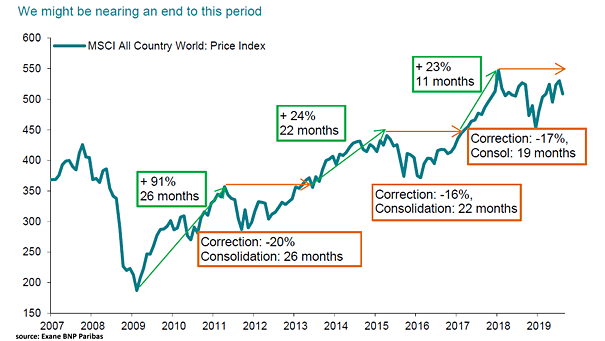
MSCI All Country World Index (ACWI) – Period of Consolidation Exane is bullish and suggests that the MSCI ACWI might be nearing an end to this period of consolidation. Image: Exane BNP Paribas
MSCI All Country World Index (ACWI) Leads Global GDP This chart suggests that the MSCI All Country World Index (ACWI) leads Global GDP by 6 months. Image: Ken Fisher
Seasonality Trends in MSCI AC World Index (Global Equities) The previously challenging seasonality headwinds faced by global equities are now turning into favorable tailwinds, potentially boosting market performance as we enter the final quarter. Image: BofA Predictive Analytics