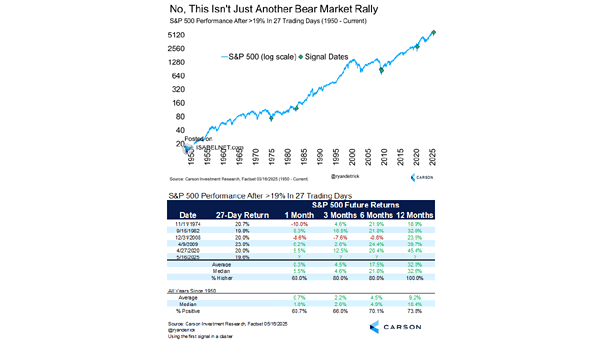
Trading Days Without a 2% Drop for the S&P 500

Trading Days Without a 2% Drop for the S&P 500 The ongoing streak without a 2% decline in the S&P 500 is remarkable, but it has occurred before. Past market cycles have recorded even longer durations without such declines, underscoring the cyclical nature of market performance. Image: Deutsche Bank

S&P 500 Performance After >25% Gain in 100 Trading Days

S&P 500 Performance After >25% Gain in 100 Trading Days An increase of 25% or more in the S&P 500 within 100 days (using the first signal in a cluster) suggests a positive outlook for the next 12 months, historically resulting in a median gain of 13.4% since 1950. Image: Carson Investment Research

Consecutive Trading Days of Inverted 10Y-2Y U.S. Treasury Yield Curve

Consecutive Trading Days of Inverted 10Y-2Y U.S. Treasury Yield Curve The anticipation of Fed easing is being driven by the aging of yield curve inversion. Market participants are expecting the Fed to cut rates in order to stimulate economic growth and prevent a potential recession. Image: Morgan Stanley Wealth Management

Consecutive Trading Days of Inverted 10Y-3M U.S. Treasury Yield Curve

Consecutive Trading Days of Inverted 10Y-3M U.S. Treasury Yield Curve The inversion of the 10Y-3M UST yield curve typically reflects market expectations of slower economic growth and potentially lower interest rates in the future. Image: Morgan Stanley Wealth Management