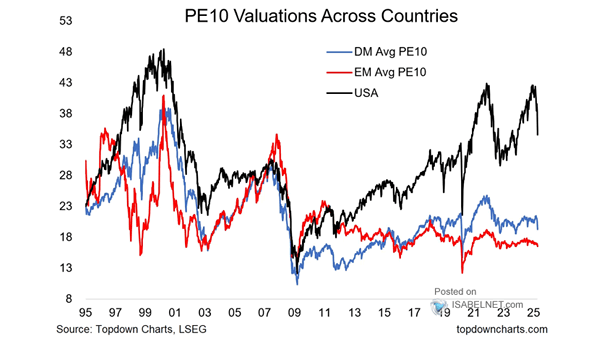
Valuation – PE10 Ratio: USA vs. Rest of the World
Valuation – PE10 Ratio USA vs. Rest of the World U.S. equities still do not look cheap vs. the rest of the world. Image: Topdown Charts
S&P 500 Price Return and USA Manheim Used Vehicle Prices As used-vehicle prices continue to decline, will the S&P 500 fall further? Image: Nordea and Macrobond
Housing – USA Case-Shiller House Price Will U.S. house prices go down soon? Image: Nordea and Macrobond
Stocks – Nasdaq vs. Russell, MSCI USA Growth vs. Value and U.S. 10-Year Real Rate Will growth stocks continue to outperform value stocks despite rising real rates? Image: Goldman Sachs Global Investment Research
Relative Equity Market Performance – USA vs. Rest of the World How long will U.S. equities continue outperform the rest of the world? Image: Topdown Charts
Performance – MSCI All Countries ex-USA vs. S&P 500 Will the S&P 500 continue to outperform global equities ex-U.S.? Image: Topdown Charts
Cycles of U.S. Equity Outperformance – MSCI EAFE and MSCI USA Relative Performance Will U.S. stocks continue to outperform developed market equities (ex-US)? Image: J.P. Morgan Asset Management
USA vs. Global Ex-U.S. Equities (Relative Performance) The U.S. stock market has significantly outperformed the rest of the world over the past decade. How long can the divergence continue? Image: Topdown Charts
Performance – S&P 500 vs. MSCI DM World Ex-USA The S&P 500 has significantly outperformed the rest of the world over the past decade. Which will do better post-Covid? Image: Scotiabank GBM Portfolio Strategy
Forward Price/Earnings Ratio – MSCI USA Index and MSCI Emerging Markets Index Emerging markets look more attractive than the U.S. market on forward earnings. Image: Morgan Stanley Wealth Management