Stocks – U.S. Free Liquidity and MSCI USA YoY
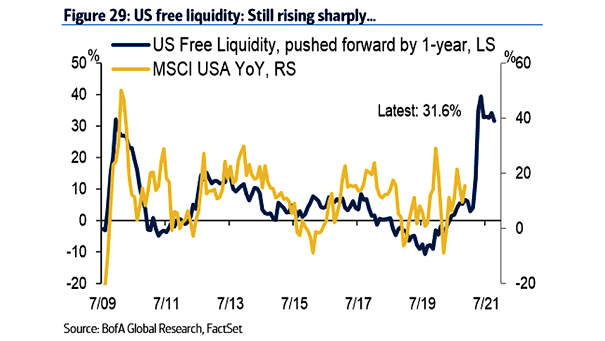
Stocks – U.S. Free Liquidity and MSCI USA YoY Should investors expect more upside for U.S. stocks, as U.S. free liquidity continues to rise? Image: BofA Global Research
Stocks – U.S. Free Liquidity and MSCI USA YoY Should investors expect more upside for U.S. stocks, as U.S. free liquidity continues to rise? Image: BofA Global Research
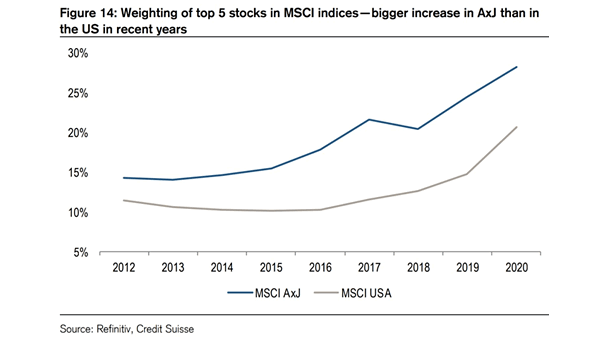
Top 5 Stocks – MSCI Asia ex Japan Index vs. MSCI USA Index The MSCI Asia ex Japan Index is more concentrated in the 5 largest stocks than the MSCI USA Index. Image: Credit Suisse

China vs. USA The number of Chinese companies in the Fortune Global 500 now exceeds that of the United States. Image: BofA Global Investment Strategy
MSCI USA Cyclical Sectors-Defensive Sectors Spread USD Index vs. 2-Year/30-Year U.S. Treasury Yield Curve This chart suggests that cyclical outperformance of defensives tends to be correlated with the shape of the 2-year/30-year U.S. Treasury yield curve. Image: Morgan Stanley Research
Small Caps: Russell 2000 vs. MSCI USA Select Strong Balance Sheet Index Chart suggesting that it makes sense to avoid balance sheet risk in U.S. small caps. Image: Societe Generale Cross Asset Research
Relative Performance MSCI Europe vs. MSCI USA The relative performance of European stocks vs. the U.S. is at its lowest level in 50 years. Will this year be Europe’s time to outperform? Image: Legg Mason
Export Destination: China vs. USA China is the largest export market of most Asian countries. Image: Danske Bank
S&P 500 Operating EPS vs. USA National Income, Corporate Profits Thanks to buybacks, this chart clearly shows the current divergence. Is a new bubble being formed? Image: Nordea and Macrobond
USA – Explaining 10-Year Yields This great chart suggests that demographics and globalization explain U.S. 10-year yields. Image: Arbor Research & Trading LLC
Global Manufacturing PMIs – USA vs. Rest of the World Global ex-US manufacturing PMI is below 50 (contraction). We will see if the United States can go it alone in the coming months. You may also like “ISM Manufacturing Index vs. S&P 500 Index since 2011“ Image: Topdown Charts
Performance – S&P 500 Relative to Rest of the World While U.S. stocks outperformed international markets for more than a decade, 2025 has seen a reversal, with American equities lagging behind most global peers—even after the recent rally. Image: Bloomberg