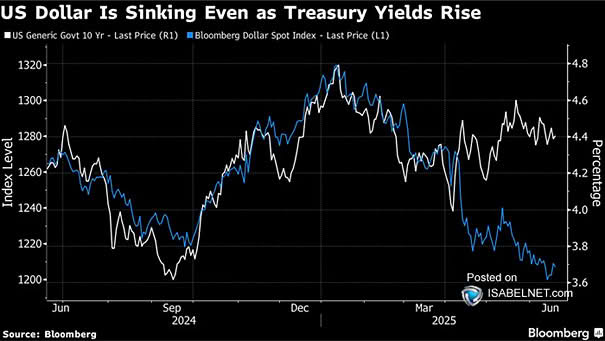
10-Year U.S. Treasury Yield vs. Bloomberg Dollar Spot Index
10-Year U.S. Treasury Yield vs. Bloomberg Dollar Spot Index The dollar’s decline amid rising Treasury yields signals concerns over U.S. fiscal health, reduced foreign demand for debt, and geopolitical risks, reflecting a shift in investor confidence and the dollar’s role as a global safe haven. Image: Bloomberg