S&P 500 Annual Return: Dividends, Earnings Growth and Multiple Expansion

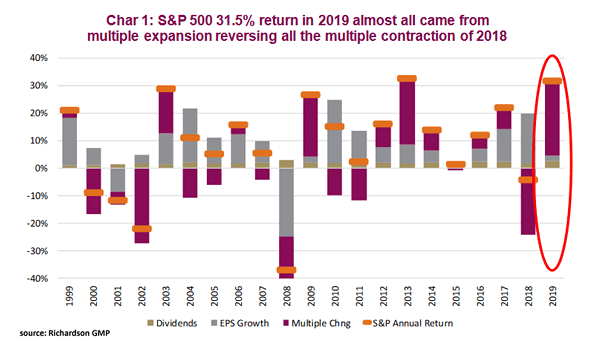
S&P 500 Annual Return: Dividends, Earnings Growth and Multiple Expansion In 2019, the S&P 500 rose 31.5%. 26.9% came from multiple expansion, 2.6% from dividends, and 2.0% from earnings growth. Historically, S&P multiples contract or remain flat following years of big multiple expansion. Image: Richardson Wealth
Multiple Expansion – Year-Over-Year Change in the S&P 500 Forward P/E

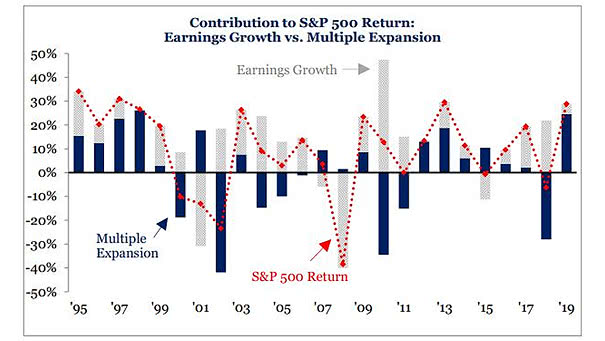
Multiple Expansion – Year-Over-Year Change in the S&P 500 Forward P/E Since the beginning of the year, the multiple expansion explains the S&P 500 return. Historically, S&P multiples contract or remain flat following years of big multiple expansion. Image: BofA Merrill Lynch US Equity & US Quant Strategy

U.S. Equities and The World: Earnings Growth vs. Multiple Expansion

U.S. Equities and The World: Earnings Growth vs. Multiple Expansion Since the 2009 low, the strong performance of the U.S. markets comes from earnings growth (73%) and multiple expansion (27%). You may also like “S&P 500 Return: Earnings Growth vs. Multiple Expansion.” Image: Goldman Sachs Global Investment Research

MSCI ACWI and S&P 500 Forward P/E Multiple

MSCI ACWI and S&P 500 Forward P/E Multiple This year, the forward P/E multiple for global equities and for the S&P 500 increased by approximately 24%. Historically, multiples contract or remain flat following years of big multiple expansion. Image: Morgan Stanley Research

S&P 500 Total Return Attribution

S&P 500 Total Return Attribution Multiple expansion explains the S&P 500’s total return YTD, despite negative earnings growth. Image: The Daily Shot

S&P 500 and Market Recoveries

S&P 500 and Market Recoveries Historically, after a crisis, market recoveries came largely from multiple expansion. Image: Gavekal, Macrobond