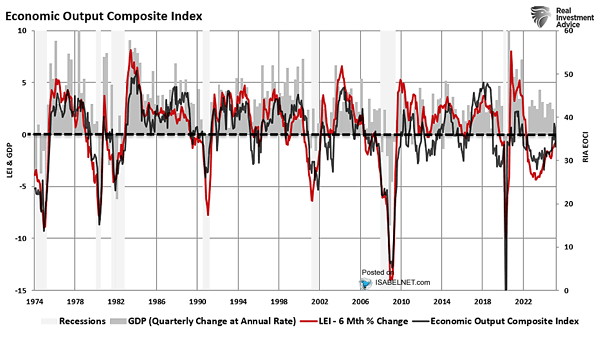
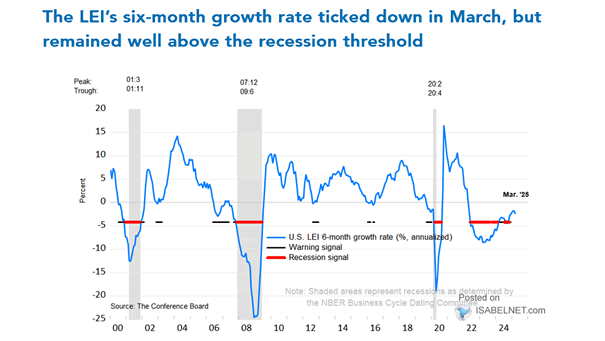
Recession – Economic Output Composite Index vs. LEI

Recession – Economic Output Composite Index vs. LEI The Economic Output Composite Index is still in contraction territory, which could have a negative impact on asset prices as earnings estimates are revised downwards. Image: Real Investment Advice

LEI 6-Month ROC vs. S&P 500 EPS Annual % Change

LEI 6-Month ROC vs. S&P 500 EPS Annual % Change The 6-month annual rate of change of the Leading Economic Index is highly correlated with S&P 500 earnings growth. Should U.S. equity investors remain cautious? Image: Real Investment Advice

Conference Board U.S. Leading Index (LEI) vs. U.S. GDP

Conference Board U.S. Leading Index vs. U.S. GDP This chart shows the good correlation between the Conference Board U.S. Leading Index Year-over-Year (white line) and U.S. GDP (blue line). The LEI is a good recession indicator. Image: Bloomberg, Jeroen Blokland

OECD Total LEI lead OECD Real GDP

OECD Total LEI lead OECD Real GDP This chart suggests that the OECD’s leading economic indicators lead OCDE real GDP by 6 months. Image: Strategas