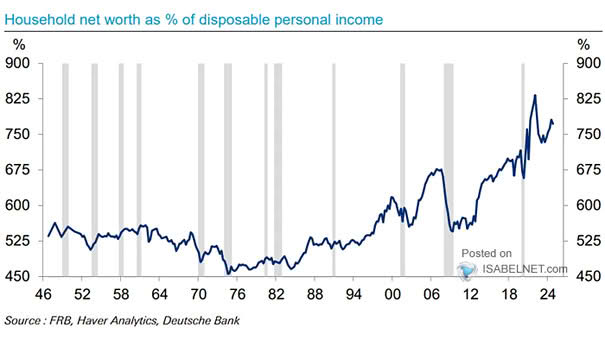
U.S. Household Net Worth as % of Disposal Personal Income
U.S. Household Net Worth as % of Disposal Personal Income The AI boom has generated significant U.S. wealth growth, but its benefits have disproportionately flowed to the wealthiest households. Image: Deutsche Bank