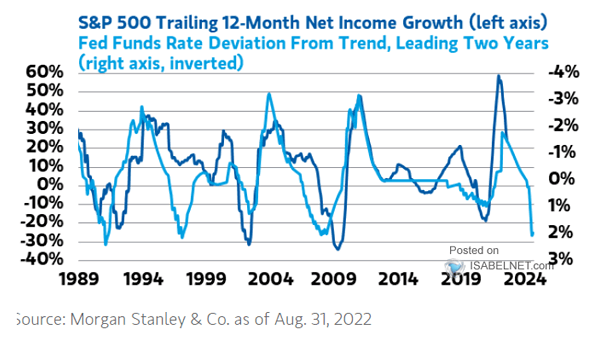
Housing Bubbles – Real House Prices vs. House Prices / Disposable Income
Housing Bubbles – Real House Prices vs. House Prices / Disposable Income Is an housing crash on the horizon? Image: MBR Partners
Flows – Fixed-Income Assets Flows into Treasury-Inflation Protected Securities (TIPS) funds have been very strong, as they offer investors protection against rising inflation. Image: BofA Global Research
Oil Price Relative to U.S. Personal Disposable Income The impact of the recent oil surge, adjusted for U.S. personal incomes, is much smaller than that of previous oil shocks. Image: Alpine Macro
U.S. Small-Cap Stocks – Share of Russell 2000 Stocks with Negative NTM Net Income The number of unprofitable companies in the Russell 2000 is rising. Image: Goldman Sachs Global Investment Research
Estimated EPS Impact from a 90bp YoY Increase in Cash Yield Through Interest Income Historically, the S&P 500 tends to do well during Fed hike cycles. Image: BofA US Equity & Quant Strategy
Household Debt as a % of Disposable Income China household debt is now greater than that of U.S. households. Image: BCA Research
National Income vs. GDP and U.S. Recessions Fast rising compensation of employees tends to precede economic slowdowns in the United States. The U.S. economic recovery is expected to slow down in 2022. Image: Real Investment Advice
U.S. Home Prices – House Prices Relative to Income per Household Are U.S. home prices relative to household incomes on the way to the moon? Image: Macrobond
Bubble – U.S. Existing House Price Divided by Median Family Income Are Americans trapped in another housing bubble? Image: Evercore ISI
Social Immobility vs. Income Inequality Countries with higher levels of income inequality have higher rates of social immobility. Will income inequality in the United States continue to worsen? Image: BCA Research
Net Income Contribution by Sector to S&P 500 This chart shows the net income contribution by sector to the S&P 500 over time. Image: Goldman Sachs Global Investment Research