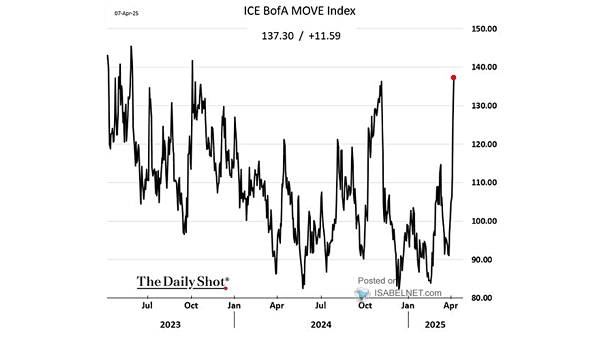
S&P 500 Returns After Quickest Moves into a Correction

S&P 500 Returns After Quickest Moves into a Correction The S&P 500 experienced one of its fastest 10% corrections from an all-time high within a month. Since 1950, it has always been higher 3 and 6 months later, with a median 6-month return of 16.8%, giving bulls reason to smile. Image: Carson Investment Research

Treasury Volatility – MOVE Index

Treasury Volatility – MOVE Index The decrease in U.S. rates volatility around a 3-year low, as indicated by the MOVE index, could be viewed as a positive development for both the bond market and the overall economy. Image: Deutsche Bank

One-Day Move in U.S. Stocks that Beat on 4Q EPS in Excess of S&P 500

One-Day Move in U.S. Stocks that Beat on 4Q EPS in Excess of S&P 500 The market’s positive response to earnings beats, despite uncertainties surrounding Trump’s policies and the Fed’s direction, suggests that strong corporate performance is outweighing other factors in driving investor sentiment. Image: Bloomberg

Bond Volatility – MOVE Index

Bond Volatility – MOVE Index The recent decline in U.S. rates volatility, as shown by the MOVE index, is like finding a calm sea after a storm—great news for both the bond market and the broader economy. Image: The Daily Shot

MOVE – U.S. Treasury Volatility Index

MOVE – U.S. Treasury Volatility Index The MOVE index, which measures implied volatility in U.S. Treasury options, has surged to its highest level since January 2024, signaling potential shifts in broader financial markets. Image: Bloomberg

S&P 500 Stocks – Average Earnings Day Moves

S&P 500 Stocks – Earnings Day Moves Last quarter set a 15-year record for earnings day volatility, with 12% of S&P 500 stocks experiencing price movements greater than 10%. Image: Goldman Sachs Global Investment Research

S&P 500 1-Day Move to CPI

S&P 500 1-Day Move to CPI The U.S. equity market’s response to CPI data is becoming less pronounced, influenced by shifting investor sentiment about interest rates and overall economic conditions. Image: BofA Global Research

S&P 500 vs. MOVE Index

S&P 500 Equal Weighted vs. MOVE Index Assuming bond volatility continues to decline, will the S&P 500 equal weighted index continue to rise? Image: Deutsche Bank Asset Allocation

Volatility Divergence – VIX vs. MOVE

Volatility Divergence – VIX vs. MOVE The divergence between VIX and MOVE presents unique challenges and opportunities for market participants, reflecting different expectations and perceptions of risk in the equity and bond markets. Image: BofA Global Research