MOVE Index vs. S&P 500 Equal-Weighted vs. S&P 500
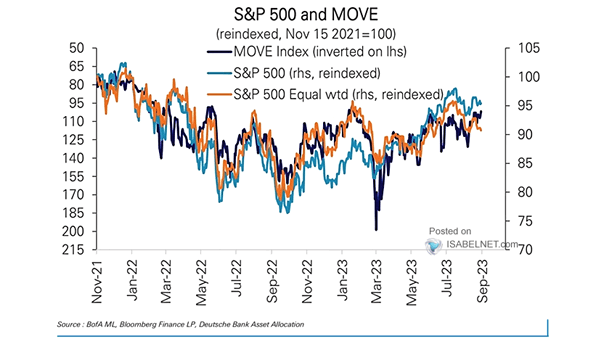
MOVE Index vs. S&P 500 Equal-Weighted vs. S&P 500 The main factor driving U.S. equities has been the volatility of rates. Image: Deutsche Bank Asset Allocation
MOVE Index vs. S&P 500 Equal-Weighted vs. S&P 500 The main factor driving U.S. equities has been the volatility of rates. Image: Deutsche Bank Asset Allocation
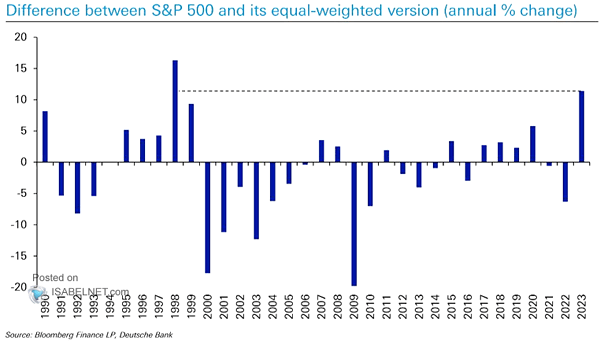
Performance – Percentage Point Difference between S&P 500 and Equal-Weighted S&P 500 Annual Price Moves The outperformance of the S&P 500 vs. the S&P 500 equal-weighted is the biggest since 1998. Image: Deutsche Bank

Volatility – VIX/MOVE Ratio The VIX/MOVE ratio is still falling. Image: The Daily Shot
Average Movements in 2s10s Slope Around U.S. Recessions Historically, when the U.S. 2s10s yield curve has been inverted by more than -100bps, a U.S. recession is currently happening or will happen within 8 months. Is it different this time? Image: Deutsche Bank
Volatility – MOVE Index U.S. Treasury bond market volatility is still elevated, despite some improvement. Image: Morgan Stanley Research
Median S&P 500 Index Move Around Last Fed Hike Historically, the S&P 500 Index’s median return exceeds 5% about 22 weeks after the final Fed hike. Image: Morgan Stanley Wealth Management
U.S. Treasury Liquidity and MOVE Indices Will U.S. Treasury liquidity continue to deteriorate? Image: BofA Global Research
2-Year Government Bond Yield Moves in Selected Countries Bond traders expect monetary policy to tighten. Image: Deutsche Bank
MOVE Index vs. U.S. 10Y-2Y Yield Curve Should investors expect a steeper yield curve and more fixed-income volatility? Image: Variant Perception Research
Markets – U.S. Rate Moves Over the recent months, U.S. rate moves have generally been “healthy”. Image: BofA Global Research
Bubbles and Bitcoin – Trough to Peak Price Moves (%) Within 3 Years of the Highs for Selected Assets Through History Bitcoin is around half of the tulip bubble in 1637. Image: Deutsche Bank Click the Image to Enlarge