MSCI All-Country World Index and RSI (14)

MSCI All-Country World Index and RSI (14) Signs of overheating are emerging in global stocks, with technical and flow indicators nearing thresholds that have previously triggered sell signals. Image: Bloomberg

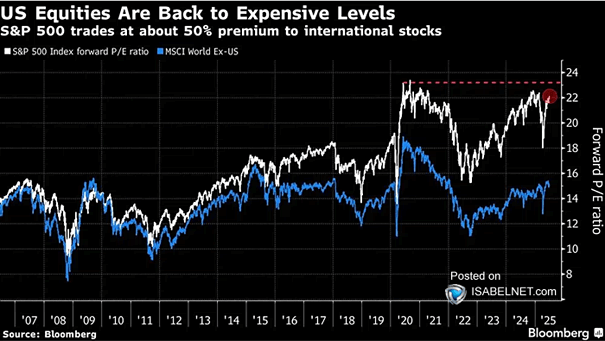
Valuation – U.S. Equities vs. Rest of World – 12-Month Forward PE Ratios

Valuation – U.S. Equities vs. Rest of World – 12-Month Forward PE Ratios U.S. equities trade at historically high valuations versus global peers, with the premium widening. While strong fundamentals support this, it also poses risks if growth expectations decline or macroeconomic conditions worsen. Image: Deutsche Bank

Performance – S&P 500 Relative to Rest of the World

Performance – S&P 500 Relative to Rest of the World While U.S. stocks outperformed international markets for more than a decade, 2025 has seen a reversal, with American equities lagging behind most global peers—even after the recent rally. Image: Bloomberg

Equity Fund Flows U.S. vs. Rest of the World

Equity Fund Flows U.S. vs. Rest of the World Over the past four weeks, U.S. equity funds have experienced substantial outflows, while equity funds in other regions have recorded inflows, indicating a shift in global investor sentiment. Image: Deutsche Bank Asset Allocation

Nominal GDP as % World for Important Countries/Regions

Nominal GDP as % World for Important Countries/Regions The Global South is rapidly emerging as the primary driver of global demographic and economic growth. For investors and businesses, it presents expanding markets and new opportunities that will be increasingly difficult to ignore. Image: Deutsche Bank

World Technology vs. World Ex. TMT

World Technology vs. World Ex. TMT Continuous technological innovation, resilience, and the expanding societal dependence on technology strongly underpin the tech sector’s prospects for sustained market outperformance. Image: Goldman Sachs Global Investment Research

S&P 500 Corrections and Bear Markets Since World War II

S&P 500 Corrections and Bear Markets Since World War II Corrections and bear markets, while inevitable and uncomfortable, often reset valuations—providing long-term investors a chance to reevaluate holdings and build positions at attractive levels. Image: Carson Investment Research

Valuation – PE10 Ratio: USA vs. Rest of the World

Valuation – PE10 Ratio USA vs. Rest of the World Investors seeking diversification and long-term growth may prefer emerging markets and non-U.S. developed markets over U.S. stocks due to their attractive valuations. Image: Topdown Charts

MSCI AC World Calendar Year Returns vs. Intra-Year Declines

MSCI AC World Calendar Year Returns vs. Intra-Year Declines Despite median intra-year drops of 15%, the global equity index ended positively in 34 of the past 45 years—highlighting the value of long-term investing over reacting to short-term volatility. Image: Goldman Sachs Global Investment Research

MSCI AC World – Bear Market Rallies

MSCI AC World – Bear Market Rallies Since the 1980s, there have been 19 global bear market rallies, lasting 44 days on average with MSCI AC World returns of 10–15%. Image: Goldman Sachs Global Investment Research

Valuation – MSCI World 12-Month Forward P/E

Valuation – MSCI World 12-Month Forward PE The current global stock market valuation, with a 12-month forward P/E ratio of 17.2, is relatively high compared to its 20-year median. Image: Goldman Sachs Global Investment Research