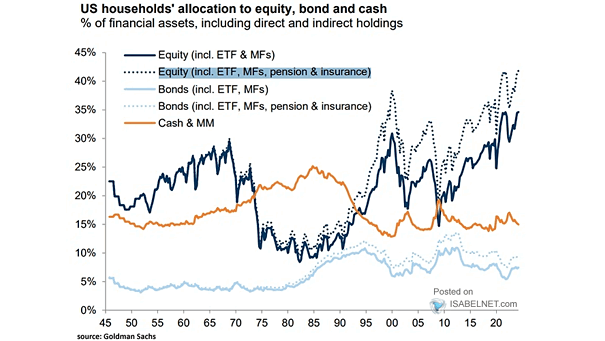
GWIM Cash Allocation as % Asset Under Management

GWIM Cash Allocation as % Asset Under Management BofA private clients’ cash allocation below the long-term average suggests confidence in the market and a focus on higher potential returns in other asset classes. Image: BofA Global Investment Strategy

FMS Average Cash Balance

FMS Average Cash Balance FMS cash level has fallen to 4.8%, putting an end to the contrarian buy signal. Image: BofA Global Fund Manager Survey

AAII Cash Allocations

AAII Cash Allocations High levels of cash allocations by AAII members can be a good contrarian indicator. Image: Topdown Charts

Buybacks and S&P 500 Use of Cash

Buybacks and S&P 500 Use of Cash Stock buybacks are just one potential use of cash by S&P 500 companies. Image: Goldman Sachs Global Investment Research

Cumulative Quarterly Inflow to Cash

Cumulative Quarterly Inflow to Cash Cash is making a strong comeback as interest rates rise. Image: BofA Global Investment Strategy

Bank Cash As a Share of Total Assets

Bank Cash As a Share of Total Assets U.S. banks have plenty of cash on hand and most banks are in very good shape. Image: Gavekal, Macrobond

Cash Flows

Cash Flows Will flows into cash continue to be strong as rates rise? Image: BofA Global Investment Strategy