U.S. Net Margin Debt
U.S. Net Margin Debt So far, U.S. margin debt as a share of market capitalization remains elevated, which reflects ongoing confidence in the market. Image: Goldman Sachs Global Investment Research
U.S. Net Margin Debt So far, U.S. margin debt as a share of market capitalization remains elevated, which reflects ongoing confidence in the market. Image: Goldman Sachs Global Investment Research
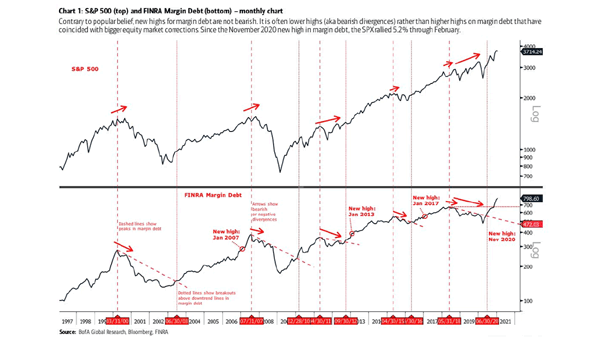
Margin Debt and MoM Change The recent three-month, $90 billion decline in margin debt is not characteristic of what is typically observed at market tops, where margin debt tends to rise or peak amid speculative excess. Image: Fundstrat Global Advisors, LLC

S&P 500 – Margin Debt Expansion vs. Contraction A decline in margin debt has historically signaled impending market turbulence, as margin debt levels often reflect investor confidence and risk appetite. Image: Topdown Charts
S&P 500 vs. Margin Debt Margin debt boosts market gains as investors leverage their positions to increase buying power. A reliable warning sign for reducing portfolio risk occurs when margin balances drop below the 12-month moving average. Image: Real Investment Advice
U.S. Stock Market – Margin Debt and Free Cash Balances The record surge in margin debt reflects heightened risk-taking among investors. If retail enthusiasm persists, this trend may continue, but elevated margin debt levels could amplify market volatility. Image: Real Investment Advice
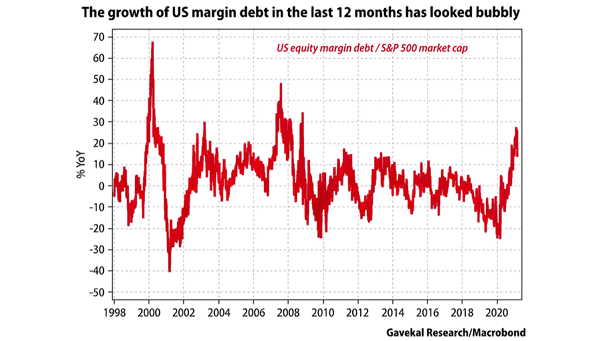
S&P 500 – Margin Debt vs. Long-Term Trend A rise in the ratio of margin debt to the S&P 500 market cap could indicate a bullish outlook for the U.S. stock market, potentially signaling confidence in the market’s upward trajectory. Image: Topdown Charts
S&P 500 and 12-Month Rate of Change in Margin Debt The rise in margin debt in June and July can be seen as a bullish signal for U.S. equities, indicating increased optimism and risk appetite among investors. Image: BofA Global Research Click the Image to Enlarge
S&P 500 Index and Margin Debt Can the YoY change in margin debt be interpreted as a positive sign for the S&P 500? Image: Morgan Stanley Wealth Management
FINRA Margin Debt and 12-Month Z-Score Is the current 12-month z-score for margin debt a contrarian bullish signal for U.S. stocks? Image: BofA Global Research
U.S. Equities – Margin Debt and S&P 500 Is the sharp decline of margin debt a contrarian bullish signal for U.S. stocks? Image: Morgan Stanley
U.S. Stock Market – Margin Debt Balances Could the level of margin debt in U.S. equities pose a risk to the bull market? Image: Real Investment Advice