S&P 500 Around Emergency Fed Rate Cuts
S&P 500 Around Emergency Fed Rate Cuts In recent history, the performance of the S&P 500 has been mixed after emergency Fed rate cuts. Image: Nordea and Macrobond
U.S. Emergency Fed Rate Cuts This charts puts the Fed’s emergency rate cut into perspective. Image: Oxford Economics
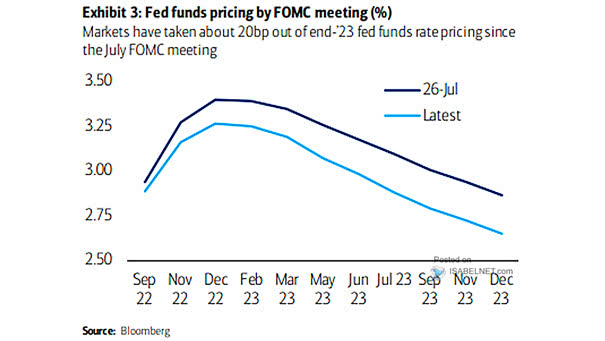
Fed Rate Cut – Overnight Indexed Swaps (OIS) Strip for FOMC Meetings over the Next 12 Months Traders see one more Fed interest rate cut this year. Image: Morgan Stanley Research
Range of Returns Two Years After Fed Rate Cut Historically, equities rally significally, when the Fed eases during soft patches. Image: Barclays Research
Break-Even Inflation Rate On 10-Year TIPS and Fed Rate Cut (Hike) If inflation expectations continue to fall or remain low, the Fed could probably cut rates further. Image: Gavekal
Fed Rate Cuts and Business Cycle Similar Fed rate cuts in the 1990s should be enough to prolong the business cycle, and should be positive for stocks. Image: LPL Research
U.S.: Market Odds of A Fourth Rate Cut The Fed may be inclined to press the pause button in the “mid-cycle” policy easing. Image: Oxford Economics
Average S&P 500 Performance Following 3rd Fed Rate Cut In the Fed rate cutting cycle, the chart shows the average S&P 500 performance following a 3rd Fed rate cut, with less than two additional cuts, and two or more additional cuts. Image: Strategas
S&P 500 Index Pre and Post Fed Rate Cuts This chart shows what the market has done every time the Fed cut rates since 1984. Image: UBS
Dow Jones Industrial Average Around Second Fed Rate Cut This chart shows that a second rate cut has been bullish. On average, the Dow Jones Industrial Average has gained 19% over the next 12 months. Image: Ned Davis Research