S&P 500 GICs Level 1 Sector Weekly Relative Rotation Graph
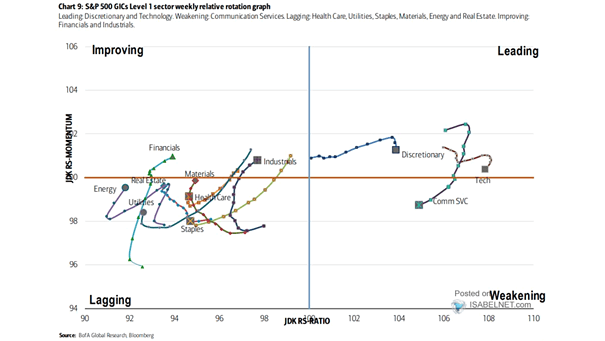
S&P 500 GICs Level 1 Sector Weekly Relative Rotation Graph Will technology and discretionary stocks continue to lead? Image= BofA Global Research
S&P 500 GICs Level 1 Sector Weekly Relative Rotation Graph Will technology and discretionary stocks continue to lead? Image= BofA Global Research
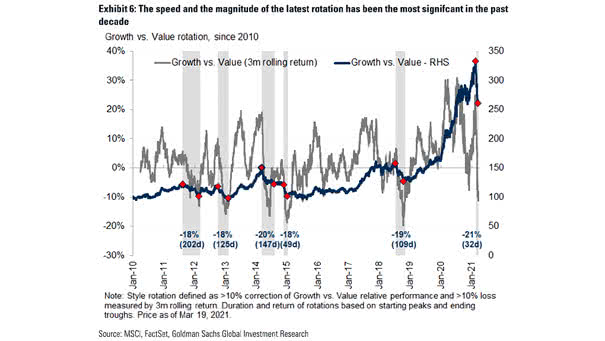
Growth vs. Value Rotation The latest rotation has been the most significant since 2010. But will Value still falter in the long run? Image: Goldman Sachs Global Investment Research

Rotation from Cash to Equities Among Major Investor Categories vs. Change in the U.S. 10-Year Treasury Yield Historically, investors tend to rotate from cash to equities when rates rise. Image: Goldman Sachs Global Investment Research
Outperformance of Procyclical Styles – Current Rotation vs. History Investors are pricing a cyclical recovery. Image: Morgan Stanley Research
Bond Yields and Rotation Trade Higher yields are good news for investors. According to BofA, the bull story next year is a reopening rotation story. Image: BofA Global Investment Strategy
Rotation vs. U.S. GDP Growth Forecasts Chart suggesting that the rotation out of bonds into equities, out of growth into cyclicals, out of large caps into small caps, and out of gold into copper, is expected to continue in 2020. Image: Fidelity Investments
Momentum to Value Rotation The rotation into value suggests a rebound in global economic growth, not a recession. Image: BofA Merrill Lynch US Equity & US Quant Strategy
Rotation from U.S. Stocks to Rest-of-World The rotation from U.S. stocks to cheaper global stocks continues, reaching $123 billion recently. Image: BofA Merrill Lynch Global Investment Strategy
Rotation from Safe to Risky Assets The market is rotating. The chart clearly shows the big rotation taking place from “safe” to “risky” assets since mid-August 2019. Image: Goldman Sachs Global Investment Research
S&P 500 and Seasonal Rotation Strategy Sell in May and go away? This chart suggests that a rotation between defensive and cyclical sectors was a much better strategy Image: CFRA, S&P Global
Gold Speculative Positions Speculative positioning in gold has declined sharply in recent weeks, driven by profit-taking, risk repricing, and rotation into other asset classes. Image: J.P. Morgan