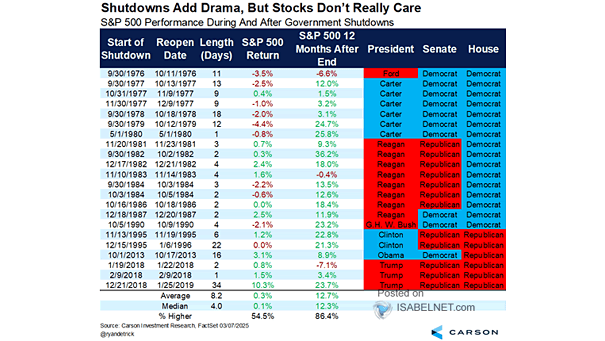
S&P 500 Performance During and After Government Shutdowns

S&P 500 Performance During and After Government Shutdowns Even the longest government shutdown in U.S. history couldn’t rattle Wall Street. Stocks held firm—and historically, once Washington gets back to work, equities have gained an average of 12.7% over the next 12 months. Image: Carson Investment Research

U.S. Government Shutdowns vs. the S&P 500

U.S. Government Shutdowns vs. the S&P 500 For all the political drama, U.S. markets have historically treated government shutdowns as little more than noise, with brief volatility giving way to quick rebounds. Image: Bloomberg

Debt-to-GDP and 10-Year Government Bond Yield

Debt-to-GDP and 10-Year Government Bond Yield While it might seem intuitive that higher debt burdens would lead to higher yields due to increased risk, this relationship has not held true in practice. Yields are influenced by multiple economic factors, not just debt levels. Image: BCA Research

Tariffs and U.S. Government Revenues

Tariffs and U.S. Government Revenues Tariffs played a crucial role in the early industrialization of the United States, but their effectiveness in today’s global economy are potentially detrimental as they act as an economic drag, hurting more industries than they help. Image: Deutsche Bank

China – Nominal GDP Growth vs. 10-Year Government Bond Yield

China – Nominal GDP Growth vs. 10-Year Government Bond Yield The persistent drop in bond yields is often seen as a sign of increasing investor caution regarding economic growth, which does not bode well for China’s nominal GDP growth moving forward. Image: Alpine Macro

Ownership of Developed Markets Government Debt

Ownership of Developed Markets Government Debt Most U.S. government debt is owned domestically, while foreign investors hold a smaller but still significant portion. Image: BofA Global Investment Strategy

U.S. Government Spending

U.S. Government Spending U.S. government spending fell by 6% year-over-year, marking a notable shift. Image: BofA Global Investment Strategy

U.S. Government Total Outlays

U.S. Government Total Outlays U.S. federal government spending has risen sharply since the 2020s, sparking debates about fiscal responsibility and the long-term implications for the U.S. economy. Image: BofA Global Investment Strategy

ISM Manufacturing PMI and Global Stocks vs. Government Bonds

ISM Manufacturing PMI and Global Stocks vs. Government Bonds In a potential shift from a “no” to a “hard” landing scenario, government bonds may outperform due to increased risk aversion, interest rate cuts, lower inflation expectations, and their historical performance during economic downturns. Image: BofA Global Investment Strategy

U.S. 30-Year Government Bond Returns

U.S. 30-Year Government Bond Returns The 30-year U.S. Treasury bond is currently experiencing a challenging period in terms of its annual return, as it is on track for the 3rd worst annual return since 1919. Image: BofA Global Investment Strategy