U.S. Treasuries Seasonality
U.S. Treasuries Seasonality Historically, U.S. 10-year yields tend to drop on average from May to November. Image: Nordea and Macrobond
Monthly S&P 500 Seasonality for Presidential Cycle Year 1 S&P 500 seasonality shows that April, May and July are strong months in Presidential cycle year 1. Image: BofA Global Research
Seasonality – MSCI ACWI (Global Equities) Historically, March and April tend to be strong months for global equities. Image: Morgan Stanley Research
Seasonality – Monthly Return Stats for the S&P 500 Historically, April has been the best month of the year on average since 1964. Image: Topdown Charts
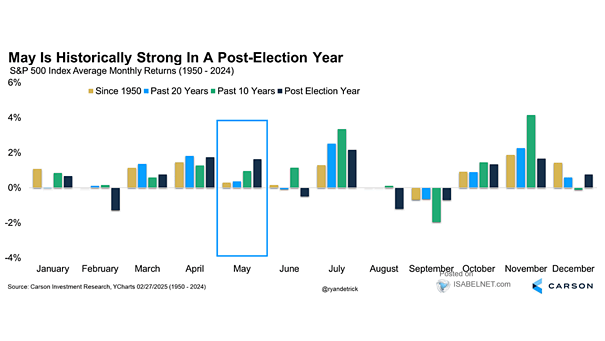
Seasonality – S&P 500 Index Average Monthly Returns Historically, April has been a strong month for U.S. stocks. Image: LPL Financial LLC
S&P 500 Seasonality Since 1928 Historically, April tends to be a good month for the S&P 500. Image: BofA Global Research
Seasonality – S&P 500 Returns in March Historically, the Ides of March tend to be bullish for U.S. stocks. Image: LPL Financial LLC
U.S. Dollar – Spot (Rally) Seasonality by Day of the Week The U.S. dollar tends to rally on Mondays since 2000. Image: BofA Global Research
S&P 500 Monthly Seasonality Historically, February isn’t usually a great month. Image: BofA Global Research
VIX – Volatility Index Seasonality of Spikes from Prior Month Low into Current Month Peak Historically, February tends to see increased risk of VIX spikes. Image: BofA Global Research