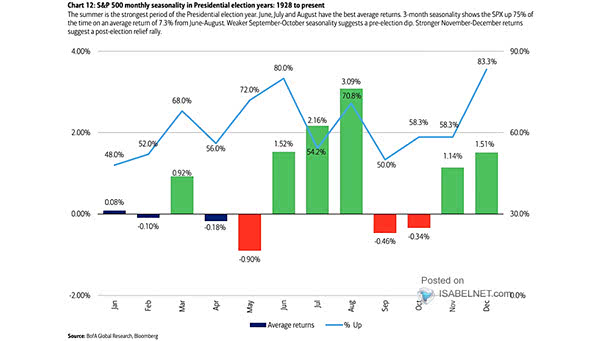
S&P 500 Monthly Returns and Percentage of Time Up – Presidential Cycle Year 4
S&P 500 Monthly Returns and Percentage of Time Up – Presidential Cycle Year 4 Seasonality serves as a valuable tool for assessing probabilities in the stock market. According to historical data, U.S. stocks often demonstrate notable strength during the summer months of election years. Image: BofA Global Research